LTC is going downLTC is now below bullish zone and entered into bearish zone. Short sell is possible.
TP is 85 and 67. SL is 110
LTCUSD trade ideas

LTC/USD Tests Critical Resistance LevelFenzoFx—Litecoin is testing the supply zone, highlighted in the 1-hour chart. The primary trend is bullish, as the price is above the 50-period simple moving average.
However, the price action techniques show that sellers exist in the resistance area, which expands from \$105.0 to \$107.0. Therefore, going long is risky at this price, since it is expensive.
That said, if the immediate resistance at \$107.0 holds, LTC/USD will likely dip toward \$100.0, aligning with yesterday's low.

LTCUSD Next Big TradeI think Litecoin has the potential for a possible retest anywhere from the price of $100 down to $45, with that retest out of the way Litecoin will most likely go back for an ATH. With strong resistance around the QP $150 it is very important to see a strong breakout from under that resistance zone to confirm the upward movement. The real battle for Litecoin I believe will be the resistance from $195 to $415. Major QP at the $200 will definitely prove to be a very hard point to cross over.

Weekly trading plan for LTCIn this video I considered the global possible price movement, also made possible scenarios for the current week
Locally the price is squeezed in a triangle, in case of a breakdown of the resistance the price will show the last 5th wave of growth before the correction
Write a comment with your coins & hit the like button and I will make an analysis for you
The author's opinion may differ from yours,
Consider your risks.
Wish you successful trades ! mura

Litecoin Stock Chart Fibonacci Analysis 051225Trading Idea
1) Find a FIBO slingshot
2) Check FIBO 61.80% level
3) Entry Point > 96/61.80%
Chart time frame: D
A) 15 min(1W-3M)
B) 1 hr(3M-6M)
C) 4 hr(6M-1year)
D) 1 day(1-3years)
Stock progress: A
A) Keep rising over 61.80% resistance
B) 61.80% resistance
C) 61.80% support
D) Hit the bottom
E) Hit the top
Stocks rise as they rise from support and fall from resistance. Our goal is to find a low support point and enter. It can be referred to as buying at the pullback point. The pullback point can be found with a Fibonacci extension of 61.80%. This is a step to find entry level. 1) Find a triangle (Fibonacci Speed Fan Line) that connects the high (resistance) and low (support) points of the stock in progress, where it is continuously expressed as a Slingshot, 2) and create a Fibonacci extension level for the first rising wave from the start point of slingshot pattern.
When the current price goes over 61.80% level , that can be a good entry point, especially if the SMA 100 and 200 curves are gathered together at 61.80%, it is a very good entry point.
As a great help, tradingview provides these Fibonacci speed fan lines and extension levels with ease. So if you use the Fibonacci fan line, the extension level, and the SMA 100/200 curve well, you can find an entry point for the stock market. At least you have to enter at this low point to avoid trading failure, and if you are skilled at entering this low point, with fibonacci6180 technique, your reading skill to chart will be greatly improved.
If you want to do day trading, please set the time frame to 5 minutes or 15 minutes, and you will see many of the low point of rising stocks.
If want to prefer long term range trading, you can set the time frame to 1 hr or 1 day.


LTCUSD 6-month analysis resultLTCUSD would have to make a few months of retracement to return to previous prices with greater strength or set a new price record. According to the analysis, the price retracement occurred exactly where it was expected and is currently on the path to increase in price.
Sasha Charkhchian

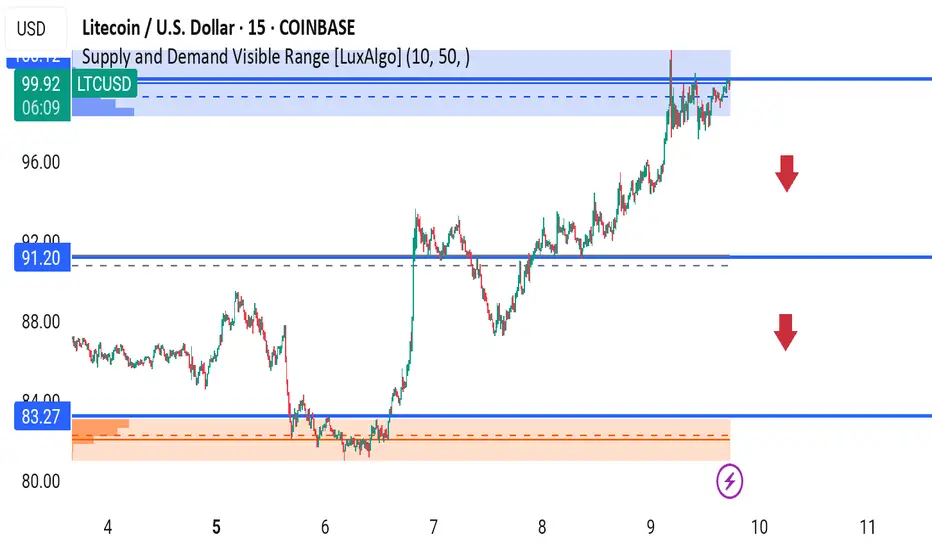
LTCUSD Hits Triple-Digit Resistance! Bearish Reversal in Sight?LTCUSD just tapped the key psychological level of $100.00, sitting within a high-volume supply zone (per LuxAlgo) where price previously reversed. Current price: $100.02 (+5.31%).
Key Technical Levels:
Supply Zone: $98.50 – $100.50 (major resistance zone)
Mid Support: $91.20 (prior breakout level)
Demand Zone: $82.50 – $83.50 (strong accumulation)
Bearish Clues:
Price stalling at supply
Low momentum on breakout
Multiple rejections near $100.00 psychological barrier
Trade Setup Idea:
Short entry near $99.80 – $100.50
Stop Loss: $101.50
TP1: $91.20
TP2: $83.30 (demand retest)
Watchlist Note:
Break and hold above $101.50 = invalidation and likely breakout rally continuation.
---
Chart Tags:
#LTCUSD #Litecoin #CryptoTrading #SupplyAndDemand #TechnicalAnalysis #LuxAlgo #ResistanceZone #BearishSetup #PriceAction
LTCUSD INTRADAY bullish breakout supported at 927.00The LTC/USD pair maintains a bullish overall sentiment, underpinned by a sustained upward trend.
Key Levels:
Support: 927.00 (primary), followed by 904.06 and 880.00
Resistance: 1,100.00, with extended targets at 1.130.00 and 1,150.00
A corrective dip toward the key support zone at 927.00 could offer a bullish rebound opportunity. A successful bounce from this level would reinforce the uptrend and pave the way for a test of the 1,100 resistance. A breakout above this level may open the door to further gains toward 1,130 and 1,150 over the longer term.
Conversely, a decisive break and daily close below 927.00 would invalidate the bullish setup, potentially triggering a deeper pullback toward the 904.06 and 880.00 support levels.
Conclusion:
While the broader trend remains bullish, LTC/USD is currently consolidating. Traders should watch the 927.00 support closely—its defence may confirm trend continuation, while a breakdown could signal a short-term bearish reversal.
This communication is for informational purposes only and should not be viewed as any form of recommendation as to a particular course of action or as investment advice. It is not intended as an offer or solicitation for the purchase or sale of any financial instrument or as an official confirmation of any transaction. Opinions, estimates and assumptions expressed herein are made as of the date of this communication and are subject to change without notice. This communication has been prepared based upon information, including market prices, data and other information, believed to be reliable; however, Trade Nation does not warrant its completeness or accuracy. All market prices and market data contained in or attached to this communication are indicative and subject to change without notice.

LTC Faced Resistance: What's Coming is InterestingFenzoFx—Litecoin faced resistance at $93.55 and has started consolidating below this level. Despite the pullback, the market remains bullish, with the price holding above the VWAP and 50-SMA.
Support is at $91.20, and resistance remains at $93.55. A sustained move above support could push the price toward $96.60.
Bearish Scenario: If Litecoin drops and stabilizes below $91.20, momentum may weaken further, targeting the next support at $89.30.

Litecoin Consolidates: Wait for This Before BuyingFenzoFx—Litecoin surged from $80.0 as anticipated. A candlestick pattern signaled this move yesterday morning. Although the bullish wave broke above the $91.9 resistance, the uptrend has since paused. Currently, the price trades slightly below this level, consolidating gains.
In swing trading, the key rule is to buy at the dip and sell at the high. Thus, we are not entering at this stage. Notably, the LTC/USD 1-hour chart shows a long-wick bearish candlestick, confirmed by another bearish close, with a decline in volume.
The trend stays bullish above the 50-period simple moving average. With immediate resistance at $93.65, the bearish momentum may test the previous day's high at $89.5. If this support holds, the uptrend could resume toward the $96.7 target.

LTCUSD INTRADAY supported at 809.00LTC/USD shows a bullish price action sentiment, supported by a sustained upward trend. Recent intraday activity indicates sideways consolidation, hinting at potential accumulation before a breakout.
Key Levels:
Support: 809 (primary), followed by 777, and 738
Resistance: 938, with extended targets at 963 and 1000
The 809 level remains the key pivot and prior consolidation zone. A pullback to this level, followed by a bullish rebound, would reinforce the current trend and open the path toward resistance at 938, with potential extensions to 963 and 1000 over the longer term.
Alternatively, a confirmed break and daily close below 809 would invalidate the bullish outlook, signalling the risk of a deeper correction. In this scenario, support levels to watch include 800, followed by 777 and 738.
Conclusion:
LTC/USD is currently consolidating within a broader bullish trend. Holding above the 809 support level is critical for continued upward momentum. A breakdown below this level would shift focus to lower support zones and suggest increased downside pressure.
This communication is for informational purposes only and should not be viewed as any form of recommendation as to a particular course of action or as investment advice. It is not intended as an offer or solicitation for the purchase or sale of any financial instrument or as an official confirmation of any transaction. Opinions, estimates and assumptions expressed herein are made as of the date of this communication and are subject to change without notice. This communication has been prepared based upon information, including market prices, data and other information, believed to be reliable; however, Trade Nation does not warrant its completeness or accuracy. All market prices and market data contained in or attached to this communication are indicative and subject to change without notice.

What will such a quick fall in LTC lead to ?In this idea I marked the important levels for this week and considered a few scenarios of price performance
The price has been falling fast enough in the last few days, there is no hint of correction yet, but the price has already reached the support level. If the price falls under it, it will tend to the second support zone
Write a comment with your coins & hit the like button and I will make an analysis for you
The author's opinion may differ from yours,
Consider your risks.
Wish you successful trades ! mura

Litecoin Invites BuyersFenzoFx — Litecoin has extended its decline from $89.5 to a key support at $81.5, the April 30 low. Strong selling pressure pushed the Stochastic Oscillator below 20, signaling oversold conditions.
Support at $80.8 could pause the downtrend, potentially leading to a rebound toward $85.5.
Bearish Scenario: If LTC/USD closes below $80.80, the decline may continue toward $79.80.
>>> Prop Trading
>>> No Deposit Bonus
>>> %100 Deposit Bonus
>>> Forex Analysis Contest
All at FenzoFx Decentralized Forex Broker

LTCUSD INTRADAY uptrend supported at 840LTC/USD shows a bullish price action sentiment, supported by a sustained upward trend. Recent intraday activity indicates sideways consolidation, hinting at potential accumulation before a breakout.
Key Levels:
Support: 840 (primary), followed by 800, 777, and 738
Resistance: 938, with extended targets at 963 and 1000
The 840 level remains the key pivot and prior consolidation zone. A pullback to this level, followed by a bullish rebound, would reinforce the current trend and open the path toward resistance at 938, with potential extensions to 963 and 1000 over the longer term.
Alternatively, a confirmed break and daily close below 840 would invalidate the bullish outlook, signalling the risk of a deeper correction. In this scenario, support levels to watch include 800, followed by 777 and 738.
Conclusion:
LTC/USD is currently consolidating within a broader bullish trend. Holding above the 840 support level is critical for continued upward momentum. A breakdown below this level would shift focus to lower support zones and suggest increased downside pressure.
This communication is for informational purposes only and should not be viewed as any form of recommendation as to a particular course of action or as investment advice. It is not intended as an offer or solicitation for the purchase or sale of any financial instrument or as an official confirmation of any transaction. Opinions, estimates and assumptions expressed herein are made as of the date of this communication and are subject to change without notice. This communication has been prepared based upon information, including market prices, data and other information, believed to be reliable; however, Trade Nation does not warrant its completeness or accuracy. All market prices and market data contained in or attached to this communication are indicative and subject to change without notice.

Litecoin Pullback In Play! | Key Demand Zone Ahead Litecoin is showing clear signs of a short-term reversal after rejecting the strong supply zone around $90.21. After a solid rally from the $82 support, price failed to break above resistance and is now forming lower highs on the 1H chart.
Bearish bias is active while trading below $89, with potential targets:
First stop: $86.64
Key demand zone: $83.27–$82.00
Watch for a bullish reaction around the demand zone — this could set up the next leg upward.
Indicators Used: LuxAlgo Supply & Demand Visible Range
Platform: Coinbase (1H TF)
Trade Idea (Not Financial Advice):
Sell below $87.50
TP: $83.50
SL: $89.80
Look for buy setups if price reacts at $82 support
Stay patient and let the levels speak!
---
Hashtags & Tags:
#Litecoin #LTCUSD #CryptoTrading #PriceAction #LuxAlgo #SupplyDemand #CryptoTA #Altcoins #LitecoinAnalysis #TradingView #BTC #Ethereum #MarketAnalysis #Scalping #DayTrading #NoLossStrategy
Emojis to Boost Engagement:
📉💰⚠️🧠📊🔍🚨

Litecoin Apocalypse, $20 forecast threatens investor extinctionIt is no secret.... Without Worries maintains a negative outlook on underdeveloped legacy crypto projects. Legacy refers to projects that have been around since 2017 with little to no development since that time. And yet they all continue to attract a significant number of long ideas.
To name a few from 2017 price action to present day:
Dash $108 versus $23
EOS. $2.40 versus 70 cents
Ethereum Classic $22 vs $17
Arguably Ethereum $471 versus $1800
Litecoin. $86 versus $86
Monero. $163 versus $255
Litecoin is amongst those without development to speak of. Despite the historical significance as one of the original Bitcoin alternatives, the monthly chart reveals a troubling pattern.
The false breakout of 2025
=====================
The pink boxes highlight the consolidation periods prior to each bull market cycle. Points 1 and 2 identify the resistance tests. The 3rd test, as is often the case in Technical Analysis, prints the breakout as indicated by the red boxes. However in 2025 after the breakout price action was returned to the consolidation area. This is a strong bearish signal. An indication buyers had no strength for momentum, which was evident from the February monthly hanging man candle print.
Monthly bearish engulfing candles
==========================
The red arrows mark each bearish engulfing candle print that followed a rally in price action. A significant correction in price action, 80% corrections, in each insistence followed the print. Is this time different? I’m sure the bulls will say so.
Going forward
===========
The bullish outlook:
Price action must recover from the fake-out with a volume sized move above $160 to undo the bearish signal. This would void the idea of a strong correction.
The bearish outlook:
Price action returning to the consolidation area is incredibly weak.
A collapse in price action would begin with a monthly candle print under $60, the consolidation area. Trade is active on this condition.
The condition would develop the $20 forecast, however the bear flag forecasts a correction of 87% to the $10 area.
Ww

LTC Holds Key Support, Eyes ResistanceFenzoFx—Litecoin bounced from the $81.80 support level and is currently trading around $84.60, just below the 50-period simple moving average. As long as LTC stays above $81.80, the outlook remains bullish, with potential to retest the $88.50 resistance.
A drop below $81.80 would invalidate the bullish view and could trigger a move toward the $77.40 support.
***
>>> No Deposit Bonus
>>> %100 Deposit Bonus
>>> Forex Analysis Contest
All at FenzoFx Decentralized Forex Broker

Global plan for LTCIn this video I considered the global possible price movement, also made possible scenarios for the current week
The price has already reached an important level and is now trying to stay above it, if the price fails to stay above the Pivot point, there are more chances to see a fall to the first support zone.
Write a comment with your coins & hit the like button and I will make an analysis for you
The author's opinion may differ from yours,
Consider your risks.
Wish you successful trades! MURA

LTCUSD INTRADAY uptrend supported at 840.00LTC/USD shows a bullish price action sentiment, supported by a sustained upward trend. Recent intraday activity indicates sideways consolidation, hinting at potential accumulation before a breakout.
Key Levels:
Support: 840 (primary), followed by 800, 777, and 738
Resistance: 901, with extended targets at 936 and 964
The 840 level remains the key pivot and prior consolidation zone. A pullback to this level, followed by a bullish rebound, would reinforce the current trend and open the path toward resistance at 901, with potential extensions to 936 and 964 over the longer term.
Alternatively, a confirmed break and daily close below 840 would invalidate the bullish outlook, signaling the risk of a deeper correction. In this scenario, support levels to watch include 800, followed by 777 and 738.
Conclusion:
LTC/USD is currently consolidating within a broader bullish trend. Holding above the 840 support level is critical for continued upward momentum. A breakdown below this level would shift focus to lower support zones and suggest increased downside pressure.
This communication is for informational purposes only and should not be viewed as any form of recommendation as to a particular course of action or as investment advice. It is not intended as an offer or solicitation for the purchase or sale of any financial instrument or as an official confirmation of any transaction. Opinions, estimates and assumptions expressed herein are made as of the date of this communication and are subject to change without notice. This communication has been prepared based upon information, including market prices, data and other information, believed to be reliable; however, Trade Nation does not warrant its completeness or accuracy. All market prices and market data contained in or attached to this communication are indicative and subject to change without notice.


LTCUSDT | Signs of Recovery Meet Strong ResistanceLTCUSDT has shown encouraging signs of a bounce, but it’s now approaching the red box, which marks a significant resistance zone. This area has repeatedly capped any rally, and without clear confirmation, attempts to push higher are likely to stall.
🔴 Key Resistance Zone
The red box represents a cluster of prior supply where sellers stepped in aggressively. Any move toward this zone demands caution, because history tells us price struggles to clear it.
📉 Short Setup Criteria
Lower-Time-Frame Breakdowns
Wait for a clear rejection inside the red box on a 5‑ or 15‑minute chart. A shift from higher highs to lower highs signals weakening bullish momentum.
CDV Confirmation
Look for a negative divergence or uptick in selling volume on CDV to confirm sellers are winning the battle at resistance.
Defined Entries
Enter short only when both price structure and volume align. Place your stop just above the red box to manage risk.
🟢 Bullish Flip Conditions
I will not insist on my short idea. If LTCUSDT breaks above the red box with strong volume and then retests it successfully as support, I will switch to a bullish bias. In that scenario, lower‑time‑frame breakouts back toward new highs will be my trigger to enter a long position.
💡 Why This Matters
We’re not guessing—this approach is built on watching how price interacts with key zones and waiting for the market’s confirmation. By trading only when conditions align, you avoid emotional decisions and position yourself for higher‑probability moves. Keep an eye on that red box. Let price show its true intent, and then act with confidence.
📌I keep my charts clean and simple because I believe clarity leads to better decisions.
📌My approach is built on years of experience and a solid track record. I don’t claim to know it all but I’m confident in my ability to spot high-probability setups.
📌If you would like to learn how to use the heatmap, cumulative volume delta and volume footprint techniques that I use below to determine very accurate demand regions, you can send me a private message. I help anyone who wants it completely free of charge.
🔑I have a long list of my proven technique below:
🎯 ZENUSDT.P: Patience & Profitability | %230 Reaction from the Sniper Entry
🐶 DOGEUSDT.P: Next Move
🎨 RENDERUSDT.P: Opportunity of the Month
💎 ETHUSDT.P: Where to Retrace
🟢 BNBUSDT.P: Potential Surge
📊 BTC Dominance: Reaction Zone
🌊 WAVESUSDT.P: Demand Zone Potential
🟣 UNIUSDT.P: Long-Term Trade
🔵 XRPUSDT.P: Entry Zones
🔗 LINKUSDT.P: Follow The River
📈 BTCUSDT.P: Two Key Demand Zones
🟩 POLUSDT: Bullish Momentum
🌟 PENDLEUSDT.P: Where Opportunity Meets Precision
🔥 BTCUSDT.P: Liquidation of Highly Leveraged Longs
🌊 SOLUSDT.P: SOL's Dip - Your Opportunity
🐸 1000PEPEUSDT.P: Prime Bounce Zone Unlocked
🚀 ETHUSDT.P: Set to Explode - Don't Miss This Game Changer
🤖 IQUSDT: Smart Plan
⚡️ PONDUSDT: A Trade Not Taken Is Better Than a Losing One
💼 STMXUSDT: 2 Buying Areas
🐢 TURBOUSDT: Buy Zones and Buyer Presence
🌍 ICPUSDT.P: Massive Upside Potential | Check the Trade Update For Seeing Results
🟠 IDEXUSDT: Spot Buy Area | %26 Profit if You Trade with MSB
📌 USUALUSDT: Buyers Are Active + %70 Profit in Total
🌟 FORTHUSDT: Sniper Entry +%26 Reaction
🐳 QKCUSDT: Sniper Entry +%57 Reaction
📊 BTC.D: Retest of Key Area Highly Likely
📊 XNOUSDT %80 Reaction with a Simple Blue Box!
📊 BELUSDT Amazing %120 Reaction!
I stopped adding to the list because it's kinda tiring to add 5-10 charts in every move but you can check my profile and see that it goes on..

LTCUSD eyes bearish bat patternOn the daily chart, LTCUSD stabilized and rebounded in the short term, and bulls have the upper hand. Currently, the upward trend is looking towards the previous supply area of 90.9-96.5. If the price reaches 92.70, pay attention to the potential bearish bat pattern.
