Litecoin ETF Approval Odds Soar to 85%—What’s Driving the Surge?The race for altcoin ETFs in the U.S. just took a significant leap forward. Litecoin ETF approval odds on Polymarket skyrocketed to 85%, following the listing of Canary Capital’s proposed Litecoin ETF on the Depository Trust and Clearing Corporation (DTCC) system.
This move mirrors the Ethereum ETF approval process, which saw its green light from the SEC in May 2024. While DTCC listing doesn’t guarantee SEC approval, it’s a crucial preparatory step that shows the application is progressing.
Why Does This Matter?
📌 Polymarket Odds Up 35% – Investor confidence in a Litecoin ETF is surging.
📌 DTCC Listing Signals Progress – Canary Capital’s application is moving through key procedural steps.
📌 Institutional Interest Growing – Asset managers like Grayscale and CoinShares are positioning Litecoin-based financial products.
The SEC’s Next Move
Canary Capital first filed for a spot Litecoin ETF in October 2024. While its status as a Bitcoin fork and commodity classification may work in its favor, the SEC’s cautious approach could still delay approval.
📌 Optimistic Case: SEC approval could boost institutional adoption and significantly impact LTC’s price.
📌 Bearish Case: If the SEC delays or denies the application, Polymarket odds could tumble, and LTC may stagnate.
Despite this news, Litecoin’s price reaction has been muted, up only 3.37% to $134.25 since Friday. The next major price move will likely depend on further SEC developments.
The question remains—will the SEC push Litecoin into the ETF era, or is this another case of premature optimism?
LTCUSDT.P trade ideas

LTC path to 2800$. TP1-700$Litecoin will grow a lot
TP1-700
TP2-2800
Tp3- 12k-20k
Litecoin - moon
DYOR!


Litecoin - Short - 3 HrsThis technical analysis is for informational and educational purposes only. It does not constitute financial advice. Remember to always research and consult with a professional before making investment decisions. Good luck! 📈💼🚀


LtcHere I show high probable scenario still keep the original idea as a basen and sometimes it can help you discover something important

Lite up my light coinYou know previously looking at this chart I really believed chart looks mostly in bear mode however after changing if you trend lines and organising it further more I can see that we can have a push towards the resistance line that's above the price.
you can see it's respecting the relative strength index signaling a potential upward movement which doesn't agree with our our previous price action . so you can see the price has stabilized over the yellow line it got rejection and I personal ly believe that over the next few days we can expect a price increase And in invalidate this chart
Litecoin-LTCUSD Analysis (Issue 66)The analyst believes that the price of Litecoin will increase. This view is based on a quantitative analysis of the price trend and is a probabilistic assessment.___
Please note that setting a stop-loss immediately after entering the trade is mandatory, while setting a take-profit level is optional.
The specified take-profit level does not imply a prediction that the price will reach that point; rather, it merely indicates the potential maximum price fluctuation within the given time frame. The outcome of this fluctuation will be recorded after a new analysis is provided.

LTC BUYhello guys
Considering the good growth of the price and after its correction, now is a good opportunity to enter into a transaction with capital management.
We have specified a target for you.
*Trade safely with us*

LTC BUYhello friends
According to the good trend we have, now we can buy in steps with risk and capital management in the price correction in the lower time frame.
*Trade safely with us*

$LTC/USDT Analysis📉 CRYPTOCAP:LTC needs to sweep the swing low liquidity before tapping the 4H +OB
🔥 There's also a 4H FVG at the bottom, adding confluence for a potential long
👀 Waiting for a liquidity sweep before entering a long position!

LTC Short, depends on BTC and BRC D.it looks like a short, but a little bit risky.
watch BTC and BTCD. too

LTC has completed the accumulation phase! LTC completes its accumulation phase of more than 896 days and is preparing for a breakout! I would expect a hike to the 0.786 Fibonacci level, as this is a project with huge capitalization, but with poor usability. With spillovers from Bitcoin, Ethereum and Solana it could show huge growth!
Horban Brothers.

LTC short positionits a smal short position before a good pump
you can use candlestick patterns in lower timeframe for entry
ltc critical updateltc forming a inverted h&d and this is the only coin to stay profitable when everything is going down, now is the time to buy imo 200-500 per ltc

LITECOIN 4H (LTC)Litecoin is one of the best performing majors in recent weeks and finds itself around the mini range highs in an area of key resistance. The way I'm looking at this chart is in two separate sections of the same mini range, a lower range and upper range with an area of indecision between that separates the two.
Despite how choppy the market has been price can be clearly analyzed in this format:
Lower range - Clear level of support where buyers are stepping into the market aggressively to rebound any sell off and pushing price up further towards the 1D 200 EMA. There is one instance of price sweeping below range low and quickly reclaiming back above, that move has been a catalyst for bullish PA ever since with a strong bullish structure.
Upper range - The top of the upper range has yet to be retested as there is major resistance area position just before it, this bearish orderblock has rejected 4 times and is now being tested for a 5th at time of writing. It is important to note that the 1D 200 EMA is currently at its highest point during this rangebound environment, coupled with higher highs and higher lows on the low time frames, Litecoin is looking good currently.
However, bitcoin is still very much the dominant force in the market, and without bitcoin paving the way I can't see LTC making a breakout move just yet. In order for Litecoin to make a run for the highs I would like to see BTC @ $98,000 with a full reclaim of the weekly midpoint (See weekly outlook).
To conclude, Litcoin is in better shape than most other coins but this rangebound environment should be treated as such until proven otherwise, no action needs to be taken in the main bulk of either the upper or lower range, just the tops and bottoms are worth acting on IMO.

Litecoin Surpasses $130 – Is a Move Toward $200 in Play?Despite broader market uncertainty and declines across major altcoins, Litecoin (LTC) has held its ground above the key $125 support level, signaling strong bullish momentum.
The asset has gained 10.72% in the past 24 hours and 15.95% over the last week, while its monthly increase stands at 12.23%. With a Year-to-Date (YTD) return of +32.56%, LTC continues to demonstrate resilience.
Technical Outlook
SMA Support – The Simple Moving Average (SMA) reinforces the bullish trend in the daily timeframe.
RSI Strength – The Relative Strength Index (RSI) has rebounded from neutral levels and is approaching the overbought range.
Trendline Support – The average trendline continues to hold, suggesting further upside potential.
Price Targets
Bullish Scenario: If momentum holds, LTC could challenge $147.25, and a break above this level may open the path toward $180.
Bearish Scenario: If sellers gain control, Litecoin may retest $115.50, with extended downside risk to $100 if selling pressure intensifies.
With current technical support intact, Litecoin appears well-positioned for continued gains. However, the market's broader trajectory will be a determining factor in whether LTC can push toward $200 in 2024.

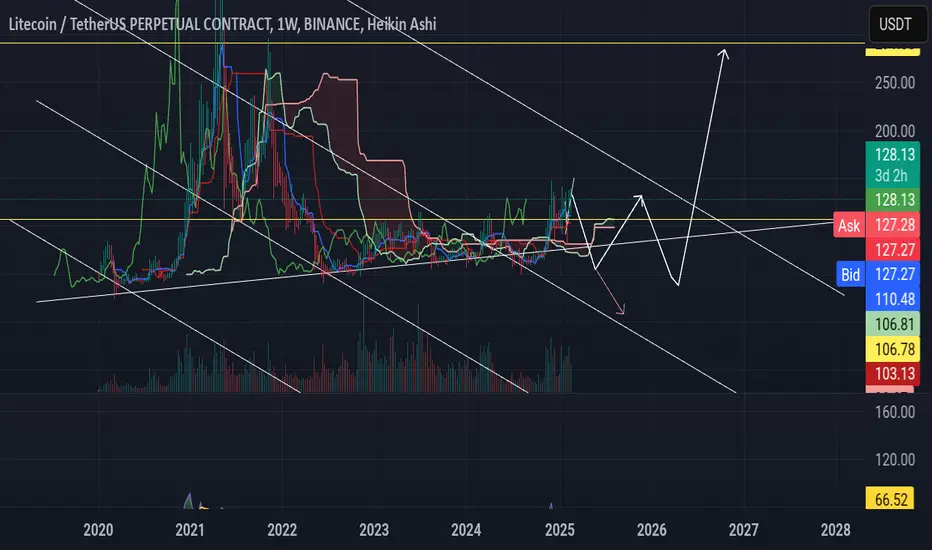
BUY SPOT LTCUSDT (W-M Swing Trade for 2025)🚀 BUY SPOT LTCUSDT (W-M Swing Trade for 2025)
📢 LTCUSDT is in a weekly correction phase, presenting a strong accumulation opportunity for mid to long-term gains.
📌 Market Outlook & Trade Plan
✔ Most coins, including LTC, are undergoing a weekly timeframe correction.
✔ The ideal buy zone was $98 - $112, but current prices ($120) are still reasonable for long-term positioning.
✔ LTC has strong breakout potential, targeting $300+ in the next major uptrend.
📌 Trade Strategy:
Trend: Buy Spot (Swing trade based on W or M cycle, depending on capital allocation).
Entry Point: $120+ is still a reasonable zone despite the ideal buy range being lower.
Target Levels:
$160 (First target)
$215 (Mid-term breakout target)
$300+ (Long-term potential)
Hold Time:
4-5 weeks if trading the W cycle.
Throughout 2025 if following M & 3M cycles.
💡 Key Considerations:
✔ Adjust capital allocation based on whether you are trading W, M, or 3M cycles.
✔ Monitor market trends and breakout confirmations for stronger momentum.
✔ Consider taking partial profits at key resistance levels for risk management.
🔥 LTCUSDT remains a strong long-term play – Accumulate and position wisely! 🚀

LtcusdtLooking bullish 140 to 145 strong resistance
If it’s break go further parabolic
If it’s reject go back its initial support

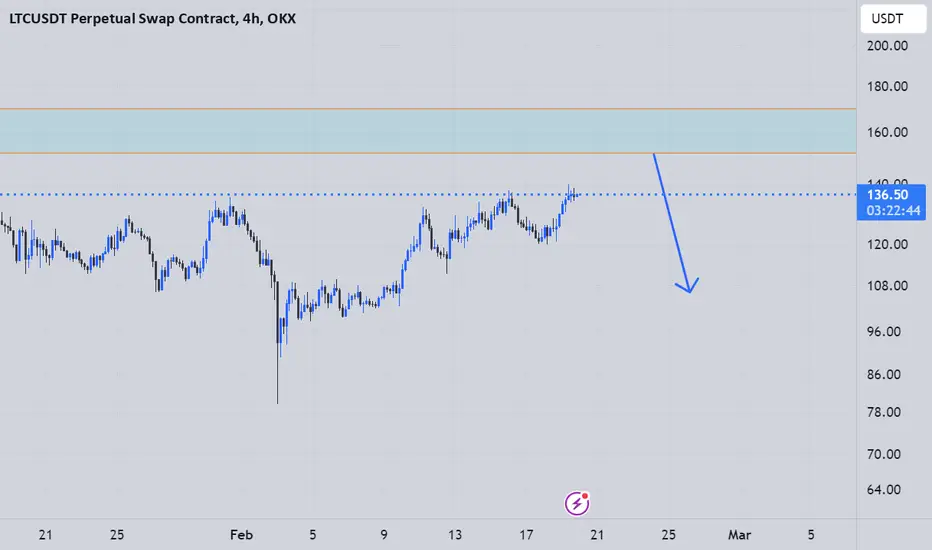
Ltc scalp short to $118Recently opened a ltc scalp short. Am targeting $118. Roughly 2.4RR
Even though etf news is looming in terms of approval and people seems quite bullish on it judging by the PA in comparison to other coins...It won't just go up in straight line.
It failed to hold prior daily support and now I think the bears will take over a little bit.
At $118 we'll likely get some demand.

LTC short short ltc at 154 as there is a monthly BB, and stop loss is just above the BB at 174 $ if the price closes abvove it then wait for a pull back into that area to look for long opportunities

LTC h chart analysis breakout guys LTC has almost finish his correction can lead to back previous top
targets are clear in chart long term target are much mush higher
enjoy the trade support my idea like and comment to reach more community
cheers

LTC about to Jump the CreekShown here is LTC on the 12 hour time frame. It is in a symmetrical triangle pattern, which typiclaly is an indecisive pattern. However, the recent dip and strong bounce up is indicative of the Wycoff Spring Setup. Instead of a Range Break Fake-Out to the downside, the Wyckoff Spring is a more like a Range Break Fake-Out to the Upisde.
The very high volume that took place on 4 February 2025, means that a 2nd minor dip is likely to occur, and I predict that the little dip taking place today on 18 Feb 0700 UTC, is that 2nd dip, or retest.
I expect some sideways movement for the next half day to day and then a major breakout to the upside after the price action decivivley breaks through the resistance level of the symmetrical triangle. This decive break above resitance is often referred to as "Jump the Creek".
