Litecoin to hit $120After the price bouncing back, it appears the next target is not far out of reach. Ltc has the potential to have a %15 surge.
LTCUSDT.P trade ideas


LTC: Double bottom reversal coming!The price of LTC has formed a double bottom, and we may soon witness a big breakout to the upside! If you're looking to trade LTC at the moment, here's a quick setup that you might find helpful!
The idea is: Buy when the price breaks above 106$ and take profits at the levels shown in the chart.
Targets:
1. 112$
2. 120$
3. 120$
-------------------------------------------
About our trades:
Our success rate is notably high, with 10 out of 11 posted trade setups achieving at least their first target upon a breakout price breach (The most on TW!). Our TradingView page serves as a testament to this claim, and we invite you to verify it!

#LTC/USDT SPOT LONG ENTRY#LTC/USDT SPOT LONG ENTRY
Leverage: 1x
Entries: $101.85
Take profit 1: $103.60
Take profit 2: $109.05
Take profit 3: $116.76
Stop Loss: $96.84
NOTE: This is just my prediction. Be sure to use STOPLOSS and remember that I am not a financial adviser. your money, your risk!
BINANCE:LTCUSD.P
Thanks
The sroced.

LTCUSDTLTC-USDT looking bullish at 1h time frame making a series of HHs AND LHs I if we use these levels given in the chart we can make some good profit.

LTCUSDT.PHello Trader BINANCE:LTCUSDT.P
point of control area ltc has a weakening market price, certainly down first to the lower area, if that happens it can be a reference for the long limit area.
Please add a comment and Positive feedback and constructive criticism are important to authors and the community.
Disclamer: Not Financial Advice

Ltc liquidity sweep then up.Ltc chart explained here. Liquidity has been formed below previous low where is FVG.I am watching to tap this area then huge pump. What are your thoughts?


Litecoin - DON'T miss this SECOND CHANCE on LTC📉Hi Traders, Investors and Speculators of Charts📈
Litecoin / LTC is an altcoin that still has massive upside potential for the coming bull season. If you have been following me for a while, you'll know I've been saying we are trading in the opening moments of a new bullish cycle . I've also referred to this as Elliot Wave Theory Wave 1.
According to my plan, this is the first impulse wave towards the upside. But the upwards wave are always followed by correction waves; a natural part of any cycle. I expected the correction phase to be close to/ before the BTC halving which is in April .
So far, we're starting to see what looks like a pullback across all crypto's. BTC corrected from 48k to 41K, and currently the bears are controlling the lower timeframes. HOWEVER - this is a great opportunity to get in at lower prices before the second impulse wave starts.
The second impulse wave is know to be the biggest one, with the biggest increase - and that's what we're looking forward to after this correction is over.
For the near term, I'm expecting LTC to trade range between the upper resistance and lower support as pointed out on the chart. This is a great re-accumulation zone, incase you missed the first one.
If you found this content helpful, please remember to hit like and subscribe and never miss a moment in the markets.
_______________________
📢Follow us here on TradingView for daily updates📢
👍Hit like & Follow 👍
CryptoCheck
BINANCE:LTCUSD.P BINANCE:LTCUSDT COINBASE:LTCUSD KUCOIN:LTCUSDT

Litecoin(LTC): Re-Testing The Broken ZoneLitecoin has had a nice meltdown from the last top zones, where we had a good breakdown of the neckline zone, and now we are re-testing it.
We are looking here for a weakness to kick in near the re-test and a potential further movement to lower zones. If all plays out nicely, we should see a movement towards 200 EMA.
Swallow Team

The last bullish chance of LTCUSDT in Mid term!
Litecoin is currently perceived as being in a full buying zone, indicating that the market conditions suggest it's a favorable time to consider buying LTC. This assessment might be based on various factors such as technical analysis, fundamental analysis, or a combination of both. Traders often look for specific price levels, patterns, or indicators to determine buying zones, which could include support levels, oversold conditions, or bullish signals.
You mentioned a significant area of investor interest or buying activity between $77 to $79. This range is considered crucial because it represents a block area where substantial buying orders are expected to be placed. Identifying such key levels can provide insights into potential price movements as they may act as support zones where buying pressure could increase.
You've set seven target prices, indicating that you've identified multiple levels at which you plan to take profits or partially close your position. Having multiple targets allows for a more nuanced approach to profit-taking and can accommodate different market scenarios. These target prices are likely based on factors such as historical price levels, technical analysis indicators, or psychological levels.
Emphasizing the importance of managing risk is essential in any trading strategy. Risk management involves measures such as setting stop-loss orders to limit potential losses, position sizing to control the amount of capital at risk, and diversification to spread risk across different assets. By managing risk effectively, traders aim to protect their capital and minimize the impact of adverse market movements.
Offering assistance in case of confusion demonstrates a willingness to support others and promote clear understanding. Trading can be complex, and it's not uncommon for traders to encounter confusion or uncertainty. Encouraging open communication and providing clarification can help ensure that traders make informed decisions and feel confident in their actions.
In summary, your trading strategy for Litecoin involves identifying a buying opportunity, pinpointing key price levels, setting multiple target prices, emphasizing risk management, and offering assistance to address any confusion. By following these principles and staying informed about market developments, traders can enhance their chances of success in the cryptocurrency markets.

LTC/USDT Price Movement ScenarioBelow is the price movement scenario for LTC.
Analyzing the asset's dynamics since mid-2022, we can observe a clear upward trend, indicating investor confidence and potential growth prospects. However, despite this, the asset is still significantly below its all-time highs, providing an opportunity for entry into positions.
Looking at the trading volume profile, we see that market participants continue to act in line with the current trend, accumulating positions to support price growth.
Currently, the asset is trading below the resistance level at $115.86, which can be considered as a potential entry point. It is expected that continued trading below this resistance level may lead to further strengthening of positions and subsequently to a breakthrough of this level.
The target level at $297.70 can be considered as the next key level.

LTCUSDT.PHello Trader BINANCE:LTCUSDT.P
SEE there is a double top pattern for the 15-minute chart, for scalping it can be used for now.
Please add a comment and Positive feedback and constructive criticism are important to authors and the community.
Disclamer: Not Financial Advice

#LTC/USDT#LTC
The price has been moving in a descending triangle since the beginning of 2022
We are about to break that downward channel
And also the moving average broke 100 upwards
Current price 70.77
First goal 88.14
The second goal is 113.45

LTCUSDT: Bullish TrendLTCUSDT is in Bullish Trend, printing HH's and HL's. Currently price is taking support from trend line and its looking very attractive for long.

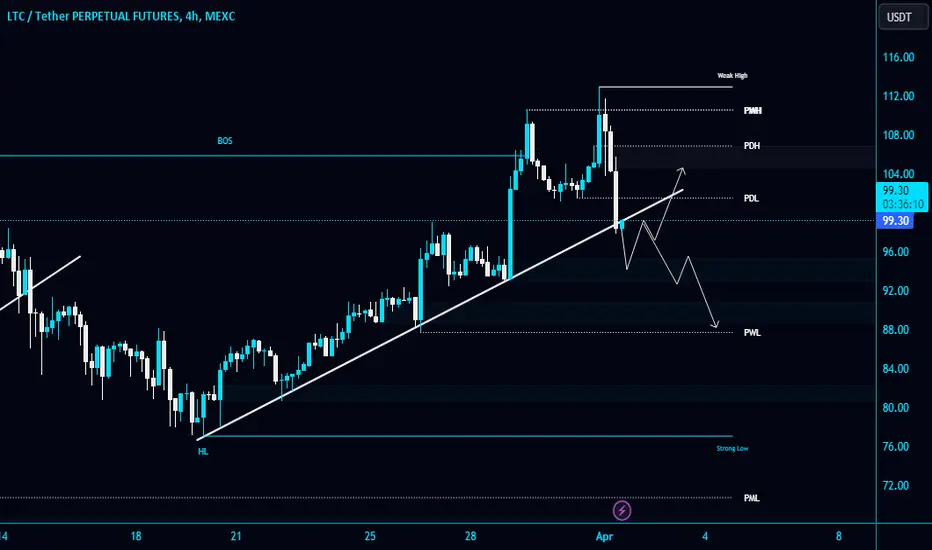
#LTC/USDT breaks the Diagonal Trendline in 4-Hour TF!#LTC/USDT breaks the Diagonal Trendline in 4-Hour TF!
Waiting for confirmation to short $LTC. I am expecting a little bounce from bullish OB $92.55 so it may retest the trendline. I will wait for a retest for a short position.
The next support level is PWL $87.85.
LTC | Litecoin | Ltcusdt | Such breakouts are opportunities LTC | Litecoin | Ltcusdt | Such breakouts are opportunities
retest of tringle is another opportunity

Ltc 20% ProfitLtc has surges 20% profit after hitting our marked fvg area. A perfect example of bullish FVG.

LTC/USDT 8HInterval Chart ReviewHello everyone, let's look at the LTC to USDT chart taking into account the 8H time frame. As we can see, the price is moving above the local upward trend line.
Going further, you can see the price fighting in a strong resistance zone from $102.33 to $115.12, when we break out of this zone, we can see an increase to the resistance level of $131.40.
Looking the other way, you can see the first support at the level of $91.29, the next strong support is at the level of 77.73, and then it is worth defining the zone from $68.23 to $56, which previously held the price.
Looking at the RSI indicator, we see that it is moving towards the upper limit, with room to make another upward move, but at this point it is worth being cautious before a potential rebound. However, the STOCH indicator bounces from the upper limit and subsequent raises result in a higher price movement.

LTCUSDT 1W LONG📈Hi all. Timeframe 1 week. LTC is fluttering in the accumulation channel near key support. There is a pressure applied to the resistance of the triangle. A decline to the 52.39 zone is unlikely, so I am considering recruiting to the spot from the current ones. Also long/futures during channel breakdown/retest. Marked goals and levels on the chart.


LTC/USDTOur spot LTC position has hit the target. According to the daily candle i suggest to take profits and wait to buy on lower prices.
