Short idea on LTCAs I wrote earlier, I like Litecoin.
There will be a halving soon (people think it's time to buy)
The market is generally positive
I like the structure
*not financial advice (these are trading ideas myself)
LTCUSDT.P trade ideas

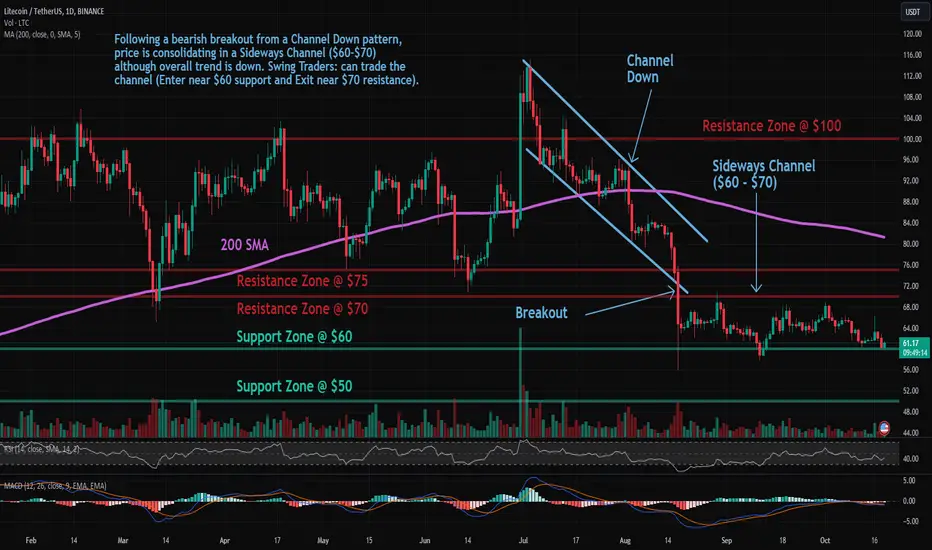
LTC: Sideways ChannelLitecoin (LTC) technical analysis:
Trade setup: Following a bearish breakout from a Channel Down pattern, price is consolidating in a Sideways Channel ($60-$70) although overall trend is down. Swing Traders: can trade the channel (Enter near $60 support and Exit near $70 resistance).
Pattern: Price is trading in a Sideways Channel , which is a neutral pattern (indication of market indecision). Trend Traders ought to wait for a breakout in either direction, although typically it breaks in the direction of the existing trend. Swing Traders can trade the range – Buy near Support and Sell near Resistance.
Trend: Downtrend across all time horizons (Short- Medium- and Long-Term).
Momentum is Bearish ( MACD Line is below MACD Signal Line, and RSI is below 45).
Support and Resistance: Nearest Support Zone is $60, then $50. The nearest Resistance Zone is $70, then $75.
LTCUSD ❕ declineTD Sequential has formed a reversal signal to the downside (4H TF)
Price broke down through 50EMA (1H TF)
RSI is moving in the sellers zone (1H and 30m TFs)
I believe that LTC will continue to decline.

Litecoin shortLitecoin bounced off the upper boundary of descending channel. Asset bounced off the resistance level. Bearish movement to support level 60.4 is expected to happen.

NEW IDEA FOR LTCUSDT By maintaining the resistance range of the ceiling of the ascending channel between 62.19-62.05, LTCUSDT can decrease to support the bottom of the channel in the range of 60.90.

LTCUSDT WILL FOLLOW A BEARISH MOMENTUMLTCUSDT created an bearish pennant followed by the bearish trend formed. Here we see a breakout and pullback on the key level where it still remains under the bearish pressure which is expected to revisit back on the highlighted support on the bottom.

LTCUSDT short idea for monthly, day, H4Hi guys. What do you think about LTCUSDT ? I think so too. The price could not break the daily and 4-hour resistance. Bitcoin is also bearish.

LTC/USDT Potential Movement to $64Hey traders👋
LTC coin had caught our attention here with a good potential for some further bearish movement here! Keeping eyes open and hand ready for a good short position here!
If you like ideas provided by our team you can show us your support by liking and commenting.
Yours Sincerely,
Swallow Team
Disclamer:
We are not financial advisors. The content that we share on this website are for educational purposes and are our own personal opinions.

LTC Under Pressure 📉, 24H & 1-Week Horizons Cloudy ☁️Cloudy ☁️, rainy 🌧️, and even stormy ⛈️ trading conditions lie ahead in the next 24 hours. This translates into a bearish market with downside risk for cryptocurrencies. Particularly Litecoin, Ethereum, Cardano, Uniswap, and Polkadot may come under pressure. Chainlink bucks this negative trend and has upside potential, according to ATTMO.
Over a one-week horizon, the bearish trend will continue to linger over the crypto universe, except for Bitcoin, Polygon, and Chainlink. Slightly bullish sun ☀️ will shine over this trio, indicating a possible upside in their prices.
Follow us for more crypto weather reports!

LTCUSDT at monthly support, likely to bounce soon.The price has been going down since it hit the monthly resistance MR1 a few months back. The price came back to monthly support and bounce from there. Now it is experiencing a pullback from that bounce and the price is currently trading at weekly support WS1 which is also close to monthly support MS1. I think the current setup is offering a good long opportunity on high time frame. The last monthly candle close has been bullish and indicates that the current or next monthly candle is going to be a green one. The price is also at the support level which is providing a good confluence. Some indicators are also indicating the direction for the price to be up side in the coming days. There can be a bit of dip into the MS1 but not necessary. Overall it is looking good for a long on high time frame.

LTC#LTC
After Halving the price dumped pretty much and currently the coin is in the long accumulation period before the next big move
#LTC is very perspective project / coin. I would recommend to buy this coin on Spot, because for Futures trading its very choppy right now.
You can see on the chart 68$ price level, that currently will stand as a strong resistance. The coin was already dumping several times from that level before. So, until we don’t see the D close above 68$ - we can’t talk about bull trend continuation.
But if it is so, then the coin can give good move until 100 - 104$ where we can see another bear reaction. (N.1)
Only if the coin will keep consolidation above 110 - 112$ in this case there will be big chance to see the LTC at around 160$ where it has Monthly FVG level (n.2)
Other wise, I expect to see continuation of consolidation between 68$ and 52$ levels. How long this consolidation will be - hard to say, depends on market conditions (n.3)
If LTC breaks below last 52$ support in this case the price can drop towards to 25$ (n.4)
Remember that this TA made on Weekly TF
It can take weeks or 1-2 months for analysis to play out.

LTC - A VERY CRUCIAL TIME - PRE & POST HALVING
We are at a crucial point right now. Being that we are at wave E of wave 4 it only means one thing, short-term drop in price to $53-50 to complete wave 5 (pre-halving) then the mid to Long-term journey to $150 begins (post-halving effect).
I have another scenario which I would like to refrain from posting for now but if this post gets 100 reactions, I will post it.

💡Trade Idea #LTC/USDT:Not a huge fan of these pennant patterns, but #Litecoin formed this bearish market structure. Be ready for anything.

LTC - 10/10 23LTC - 10/10/23
**Trade setup:**
LTC is trapped in between this supply and demand zone since the fall from $84, if it is broken there is a FVG to tap into around $72 a break of $72 will turn the trend bullish again!
If this DEMAND zone is broken it will head for the low it created 16th AUG!

LTC/USDT Looking Weak!Hey traders👋
LTC coin is next on our watchlist where we see a great potential for this coin to move to lower zones resulting in a potential 5% of market movement. Let's wait for good momentum here and ride the ride))
If you like ideas provided by our team you can show us your support by liking and commenting.
Yours Sincerely,
Swallow Team
Disclamer:
We are not financial advisors. The content that we share on this website are for educational purposes and are our own personal opinions.

Litecoin shortLitecoin broke trough the support level. Asset broke trough the ascending trendline. Bearish movement to support level at 58.3 is possible.

LTC short - swing trade (update)LTC playing out pretty nicely so far. First partials taken and stops at breakeven.
Will look to see how we play further from here. Overall trade should be interesting as we go along with the day. No need to chase it.
We are playing it level to level. Overall LTC is still looking pretty heavy and bearish so let's see IF we get a continuation towards the downside.
TP 65.15$
TP 63$
SL breakeven
Stay safe and never risk more than 1-5% of your capital per trade. The following analysis is merely a price action based analysis and does not constitute financial advice in any form.

LTC short - swing trade Will look to short LTC between 64.95$-64.90$ looking for the liquidity towards 64.15$ and 63$.
Overall pair is looking pretty heavy and bearish so let's see IF we get a continuation towards the downside.
Hard stops and invalidation at 65.85$.
Let's see how we play out from here.
Stay safe and never risk more than 1-5% of your capital per trade. The following analysis is merely a price action based analysis and does not constitute financial advice in any form.

LTC/USDT 4HInterval ReviewHello everyone, I invite you to review the chart of LTC in pair with USDT, on a four-hour interval. First, we will use the yellow line to mark the downward trend lines from which the price has gone up, while locally we can see that we are moving in a sideways trend channel.
Moving forward, we can move on to marking support areas when we return to the correction. And here you can see that the lower border of the channel is also a support zone lasting from $63.28 to $61.97, but when we fall lower, we still have support at $60.10, and then support at $57.69.
Looking the other way, we see that the price has reached an important resistance zone from $65.71 to $67.91, which it does not have the strength to break yet. However, if we manage to break out of this zone and the upper border of the channel, we still have strong resistance at $70.69.
Please look at the CHOP index, which indicates that we have a lot of energy for the upcoming move. On the STOCH indicator, we are exceeding the upper limit, which may end the current upward movement and translate into a price recovery, while on the RSI indicator, there is still room for the price to grow.

#TOBTC #LQR #LTCthese sell entry are not a financial advice
you have to user thee levels as suport and ressitace
alwyass DYOR

Litecoin Finished it’s 7th Wave! UP UP UPLitecoin has completed it’s last and final Elliott Wave down! I don’t see us going lower, but only going up to make a new high.
Simple & Clean Analysis!
Happy Trading! ⚔️

LTCUSDTIt is a head & shoulders in 4h, we can buy in 67.5$ to 68.5$ whit TP1: 70.5$ TP2: 77.5$ SL62.5$

Litecoin longLitecoin is bouncing off the support level which is alsi matching with the Fibonacci 0.5 retracement level. Bullish trend is expected to continue up to 68.8.
