Litecoin’s Bearish Signal: LTC dropped nearly 10%.Litecoin’s Bearish Signal: LTC dropped nearly 10%.
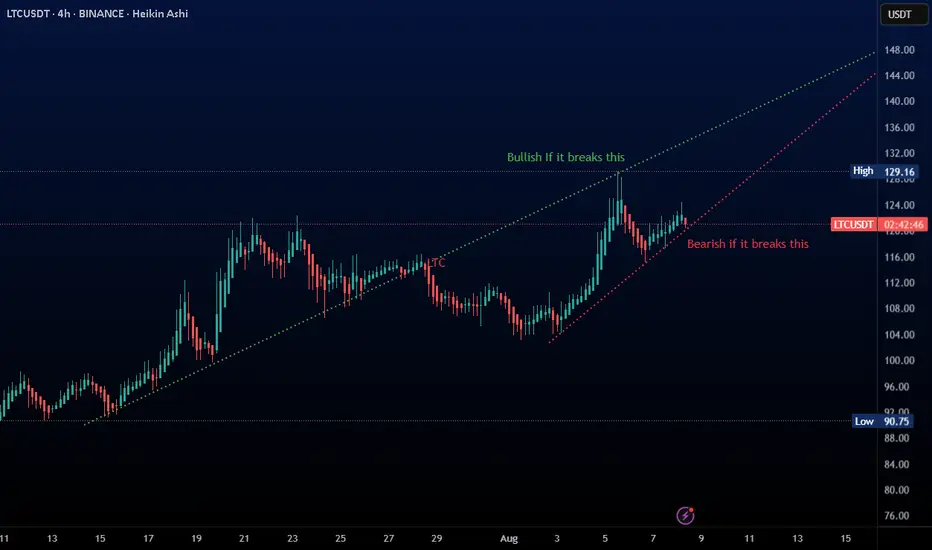
Litecoin formed a bearish harmonic pattern on the daily chart, completing near 129.20. This setup hints at a potential deeper correction or bearish wave—though that still needs confirmation.
Right after the pattern completed, price showed a strong rejection from the completion zone, adding weight to the bearish scenario.
Within 24 hours, LTC dropped nearly 10%.
I’m expecting a minimum pullback to 105.50. If the correction follows its natural path, price could revisit the previous key support zone near 89.
You may find more details in the chart!
Thank you and Good Luck!
PS: Please support with a like or comment if you find this analysis useful for your trading day
LTCUSDT trade ideas

Litecoin Eyes $133 After Breaking $122 – 13% Upside AheadHello✌️
Let’s analyze Litecoin ’s price action both technically and fundamentally 📈.
🔍Fundamental analysis:
Litecoin’s ETF approval looks likely (90% odds!), and if it happens, we could see $400–500M inflows – just like Bitcoin’s ETF boost.
But yeah, SEC delays still shake the price… LTC dropped 2% after the latest holdup. 📉⏳
📊Technical analysis:
BINANCE:LTCUSDT has broken above the key $122 level; holding this as support may lead to a move toward $130–133, offering a potential 13% upside. Traders should watch price action for confirmation near these zones. 📈🪙
✨We put love into every post!
Your support inspires us 💛 Drop a comment we’d love to hear from you! Thanks, Mad Whale

Litecoin (LTC): Aiming For $145 Area Before Potential CorrectionLitecoin looks good for potential upside movement here, although trades are not the best to take but we definitely see a good shorting opportunity appening soon.
More in-depth info is in the video—enjoy!
Swallow Academy

Litecoin Long-Term · Update · $642 & $1012We looked at Litecoin recently, it was on the daily timeframe. Immediate resistance sits at $150/$145. Think about this...
Looking at this chart, it is easy to see that Litecoin is trading at bottom prices. It is a bit high compared to all the peaks since 2022 but still low compared to 2021.
Now, this is all good. The "bit high" shows that buyers are present and buying, there is interest in accumulating Litecoin because prices continue to grow. Then the bottom has also been rising, a rising trendline, and this since June 2022.
If you go back to 2018-2020, there is a similar period. Litecoin hit bottom from a bear market and then started to consolidate. The consolidation phase had some bullish action coupled with higher lows. Same as now.
Needless to say, the end result was a massive bullish run, the 2021 bull market. We are seeing the same now but in 2025, market conditions are all the same. Litecoin hit bottom after a strong bear market and started to consolidate. The consolidation period shows a ranging market but still with higher highs and higher lows.
Litecoin is now at resistance while pushing higher, volume is starting to show.
The next target is $642 but Litecoin can go higher, this is only the next high. We have to wait and see for how long the bull market will go. The next target after $642 is $1012.
Thank you for reading.
Namaste.

Litecoin Hits a New High · Update · Highest Price in 5 MonthsToday Litecoin hit its highest price in more than five months, since March 2025. Soon Litecoin will break its December 2024 high and produce the highest prices since the last bull market, 2021. We are getting very close now.
A few weeks back the market was in a similar situation, doubt started to creep in and people wondered if the market was set to endure a long-term correction or resume higher. We used Bitcoin Cash which was moving ahead to prove the rest of the market would do the same and it happened as predicted. Before Bitcoin Cash, further back, we used XRP and it worked.
Today we are looking at Litecoin and the action this chart is showing matches additional growth. While some pairs are retracing or consolidating, others continue to move ahead. This only happens in a bull market, and, when Bitcoin retraces while the altcoins continue to grow, this is a sure sign that the bulls are buying and the market expects additional growth.
Additional growth but remember retraces will always be present along the way. The market grows steadily but it takes time. Five steps: three steps forward, two step back. Allow time for variations. Retraces and corrections are an opportunity to rebuy and reload.
Secure profits when prices are up; buy back at support.
Sell when prices are high; sell when the market is green.
Sell when everything feels fine and great.
Buy when prices are low; buy when the market is red.
Buy when everything feels down and depressed.
Go against the market impulse. Make your decisions based on information. The market is growing and set to continue growing long-term. Choose wisely and let the market take care of the rest.
Namaste.
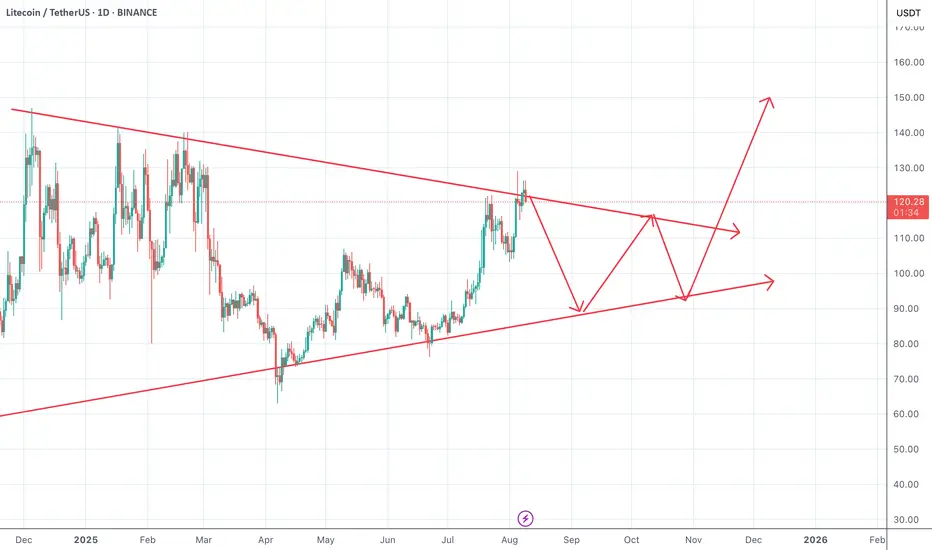
LTC Following Perfect Trend, May Breakout SOON !!! Keep an eye on these 2 trendlines for perfect setup
I have bought LTC as per below :
Bought Price : 120
TP : 130 +
Tight SL : 118 (To avoid risk)
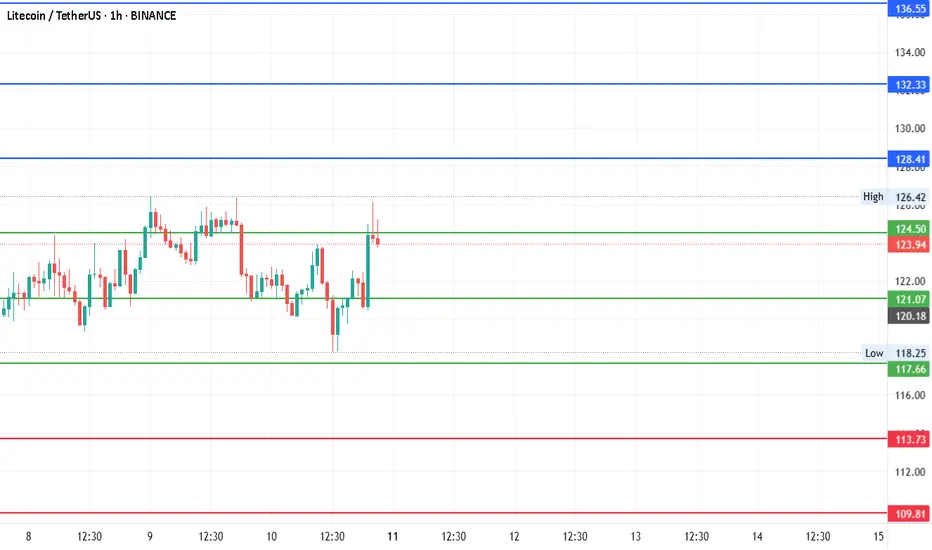
#LTCUSDT - Between 101 and 141 is the range for Aug 2025Date: 10-08-2025
LTCUSDT - Current Price: 124.8
Pivot Point:121 Support: 118 Resistance: 124
Upside Targets:
| 🎯 Target 1 | 128 |
| 🎯 Target 2 | 132 |
| 🎯 Target 3 | 137 |
| 🎯 Target 4 | 141 |
Downside Targets:
| 🎯 Target 1 | 114 |
| 🎯 Target 2 | 110 |
| 🎯 Target 3 | 106 |
| 🎯 Target 4 | 101 |
#TradingView #Nifty #BankNifty #DJI #NDQ #SENSEX #DAX #USOIL #GOLD #SILVER
#BHEL #HUDCO #LT #LTF #ABB #DIXON #SIEMENS #BALKRISIND #MRF #DIVISLAB
#MARUTI #HAL #SHREECEM #JSWSTEEL #MPHASIS #NATIONALUM #BALRAMCHIN #TRIVENI
#USDINR #EURUSD #USDJPY #NIFTY_MID_SELECT #CNXFINANCE
#SOLANA #ETHEREUM #BTCUSD #MATICUSDT #XRPUSDT
#Crypto #Bitcoin #BTC #CryptoTA #TradingView #PivotPoints #SupportResistance
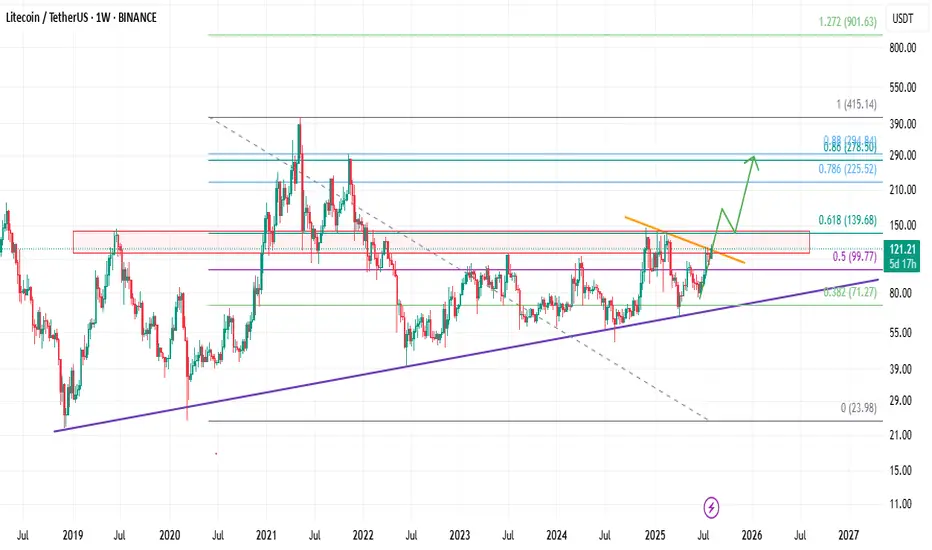
Litecoin Looks Ready – Breakout or Fakeout!Hello Traders 🐺
As you can see on the weekly chart, price is trying to break above the resistance line, which is in alignment with the red weekly resistance box and the 0.618 Fibonacci level.
Long story short:
If price manages to push above the 0.618 level — which is a very important resistance — we could expect a higher price target around the all-time high level at the 0.786 Fib zone.
And as always my friend, remember:
Discipline is rarely enjoyable, but almost always profitable.
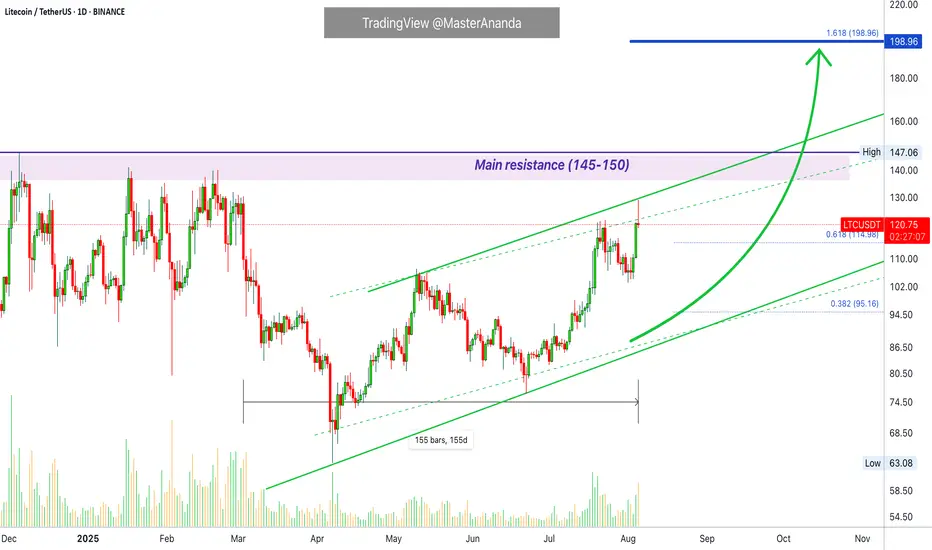
Litecoin: Major Expansion or Still Too Early?Price Action & Key Zones
Litecoin COINBASE:LTCUSD BINANCE:LTCUSDT continues to move within a multi-year consolidation range. The monthly chart clearly shows the range that has held since 2022. Key levels to watch:
Resistance at 145–150 USD — a key seller zone that has repeatedly acted as a reversal area.
Zone 150–180 USD — monthly imbalance, likely to serve as major resistance on breakout.
Range 195–270 USD — bearish order blocks, which will also act as overhead resistance.
On both monthly and weekly timeframes, LTC appears to be in a phase of accumulation or reaccumulation. A breakout from this structure will likely take time.
Wave Analysis: Two Scenarios
1. Base scenario : LTC is still forming a contracting triangle. Currently, it is developing wave D, which should test the monthly imbalance in the 150–180 range. After that, a correction in wave E (bearish phase) is expected, followed by a potential upward impulse.
2. Alternative scenario : the triangle is already complete, with wave E having formed at $62 in December 2024. A new upward expansion has begun. However, this version is not supported by the triangle’s geometry — none of its sides align with the 0.618 Fibonacci ratio. Also, proper distribution in such cases typically takes at least 6 months, and BTC might not have that much time left in its cycle.
Therefore, I stick with the base scenario: LTC is still in the accumulation phase.
Targets & Timing
Near-term targets: $107 → $128 → $147 (December high).
Maximum target for this cycle — $180, where a major reversal or distribution may occur.
On the 4H chart, a 5-wave impulse structure formed from April to May (likely wave A), followed by a sharp correction. Currently, wave C appears to be unfolding, and based on Fibonacci extensions, it could reach between $128 and $180.
Fundamental Drivers for Growth:
1. Litecoin remains a reliable payment network, offering fast transactions and low fees — often referred to as “digital silver.”
2. LTC mining is synchronized with BTC, making it a logical choice for certain miners.
3. In many regions, LTC is actively used for cross-border transfers and capital movement.
4. Undervalued compared to other altcoins, with no centralization concerns or SEC scrutiny — this could attract more institutional interest.
5. ETF Potential: after BTC and ETH, Litecoin could be the next natural candidate for a spot ETF. If approved, this could trigger a significant surge in interest and liquidity.

LTC/USDT Trade Plan: Litecoin & Nasdaq CorrelationKeeping a close eye on Litecoin (LTC/USDT) ⚡ — after a bullish breakout from a healthy pullback 📈, I’m eyeing the potential for continued upside momentum 🚀. This perspective remains heavily correlated to the performance of the NASDAQ; if equities continue their bullish trajectory 🟢, I’ll be looking to position myself in line with Litecoin strength.
In the video, we also dive into the Fibonacci extension tool to identify potential targets 🎯 and combine this with historical support and resistance levels 📍. Another key component of my analysis is the anchored volume profile, which I’ve demonstrated throughout the walkthrough 📉.
This is all part of my execution plan 📊 — full details are provided in the video and should not be considered financial advice ⚠️.

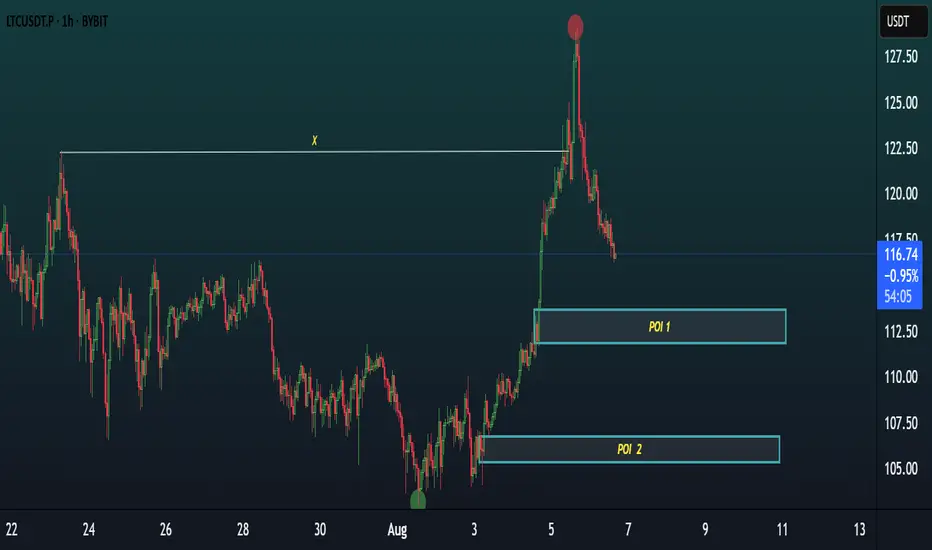
LTC/USDT 1H CHART BREAKDOWN.LTC/USDT 1H Chart Breakdown 🔍
Price swept major liquidity at the top and is now retracing.
We have 2 key POIs (Points of Interest) below:
📍 POI 1: Aggressive entry zone
📍 POI 2: More discounted price for safer long entries
⚡ Watch for bullish confirmation inside these zones for potential reversal to the upside. Smart money may accumulate here.
Scalp & intraday traders — stay sharp!
LTCUSDT UTAD ceiling in DISTRIBUTION structure and hitting Lowell 0.86 cycle higher and moving down
ARAM PISHBIN

LitecoinLtc usdt daily analysis
Time frame hourly
Risk rewards ratio >2.7👈👌
Short position
Target 100.5 $

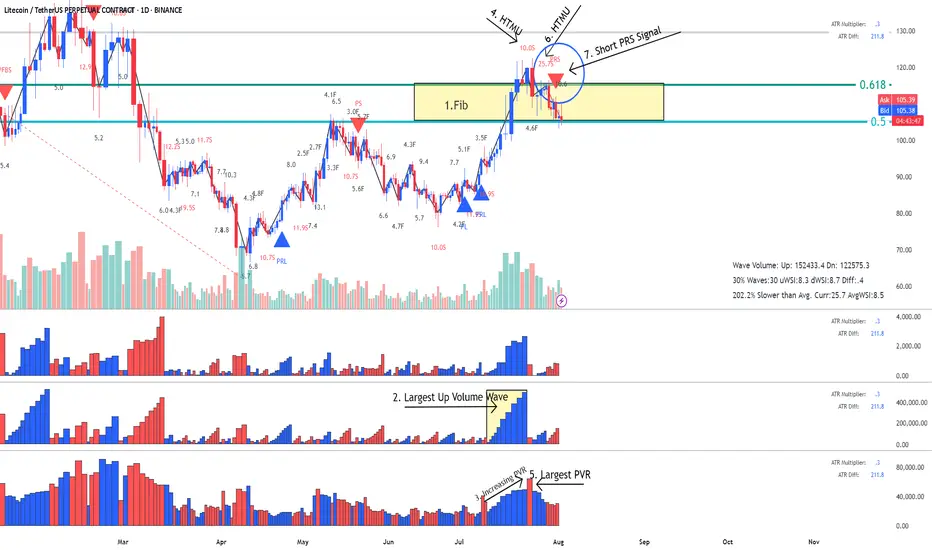
LTC- LitCoin - This is how a Fake Break on Fib looks like This is how a Fake Break on Fib looks like using Weis Wave with Speed Index
Reading the Daily Cha rt
1. Fib Location - Sellers could enter here
2. Largest Up volume wave after a while - also sellers could be hidden in there.
3. Increasing PVR (progressing volume rate) = as we approve the top more volume comes in (sellers)
4. This up wave has the highest Speed Index 10.0S of all the up waves in the trend, that's a HTMU (hard to move up = sellers)
5. The highest PVR bar =sellers
6. Another Abnormal Speed Index 25.5 S - that's another HTMU = more sellers on the up move, price cannot progress upward anymore.
7. and finally down we go with a PRS signal.
All the ingredients for the Short were there. Reading Weis Wave with Speed Index is like reading a book, page after page, until you reach to the last page that the writer has kept the surprise, the only difference is that this is never ending chart book with many stories. This was the story of LTC for now. I think this story has not ended yet and continue to drop to another Fib, the details on the 1HR!.
I hope you enjoy this chart reading lesson using Weis Wave with Speed Index.
LTCUSD Possible Scenario breakout of trendline resistanceLTCUSD is at major support and has now broken the resistance and price will likely will move up.

LTC Wakes Up — Bullish Adam & Eve Targets $150+LTC is gaining serious momentum, breaking through key resistance levels and printing a clean Adam & Eve bullish reversal pattern. The breakout signals a potential shift in the macro trend — and the chart is offering clear setups.
✅ Breakout Through $100 & Pattern Confirmation
LTC confirmed the Adam & Eve double bottom with a breakout above $100, a major psychological resistance.
The neckline retest around $105 acted as a Market Structure Shift (MSS) confirmation, with upside wicks signaling strong demand and a reversal.
$100–$105 Support Zone: Stacked Confluence
This zone offered a high-probability long setup due to multiple overlapping technical factors:
Yearly Open (via DriftLine - Pivot Open Zones ): $103.28
0.382 Fib Retracement: $104.67 (from $76.17 low to $122.29 high)
Anchored VWAP from the $76.17 low
POC of 1-Year Trading Range: ~$102
233 EMA & SMA (4H TF): Both moving averages aligned between $103–$100, acting as dynamic support
✍️ A clean, high-confluence demand zone between $100–$105 — ideal for long setups.
Upside Structure & Next Long Opportunity
➡️ Current Price: ~$127
A fresh long setup may present itself around $120 on a pullback
➡️ Pattern Target: $150
🌀 1.0 TBFE: $149.28
🌀 1.618 TBFE: $147.31
🔺 Key Swing High / Liquidity Pool (BSL): $147–$150 — an area to watch for possible rejection
🔴 Short Setup Consideration
➡️ Short zone: $147–$151
Only short on clear confirmation: SFPs, rejections, or bearish order flow
➡️ Downside target: $135 (1:2 R:R potential)
Macro Bullish Target: $198–$200
If LTC breaks and holds above $150, the next macro target becomes:
🌀 0.618 Fib Retracement (from $295.7 high to $40.3 low): $198.14
$200 Psychological Resistance: Major round number, likely to act as magnet and profit-taking zone
🛠 Indicators Used:
DriftLine — Pivot Open Zones
↳ For key levels like the Yearly Open, crucial in confluence stacking
📚 Educational Insight: Understanding the Adam & Eve Pattern
The Adam & Eve pattern is a classic bullish reversal formation that often marks the end of a downtrend or a major correction phase.
Adam forms first: a sharp, V-shaped low — often panic-driven or capitulation.
Eve follows: a rounded, more gradual bottom, showing accumulation and stabilisation.
Once price breaks above the neckline, the pattern is considered confirmed.
A retest of the neckline (like LTC at ~$105) is often the best entry point, especially when supported by confluence like Fib levels, VWAP, or key levels.
In LTC’s case, the breakout above $100 and successful retest at $100–$105 validates the pattern — with a measured move pointing toward $150, and a macro Fib target at $198.14 aligning with the $200 psychological level.
Summary:
With a confirmed breakout, strong technical confluence, and clearly defined targets, LTC is setting up for continuation. Watch $120 for long entries and monitor $150 for potential rejection.
_________________________________
💬 If you found this helpful, drop a like and comment!

LTC/USDT- Mega classic box Litecoin (LTC) has spent the last three years forming a textbook accumulation pattern, specifically a classic horizontal box range, with key support around the $100 zone acting as a historical floor. This level has held through multiple bearish cycles, showing strong buyer defence and accumulation interest from long-term holders and institutions.
After a prolonged consolidation, bullish momentum is emerging, as evidenced by:
Breakouts above mid-range resistances with volume
Successful retests of the $100 level confirming it as solid support
Emergence of higher lows and bullish structure on the weekly chart

LTC / USDT TRADE We hope you find our charts of use, please hit the like button if you found this chart useful. Safe trading everyone Check today's analysis below.⠀

LTCUSDT sleeping giantLTC was consolidating for a long period of time, and ready to blast off soon.
Targets are on chart.
DYOR
NFA

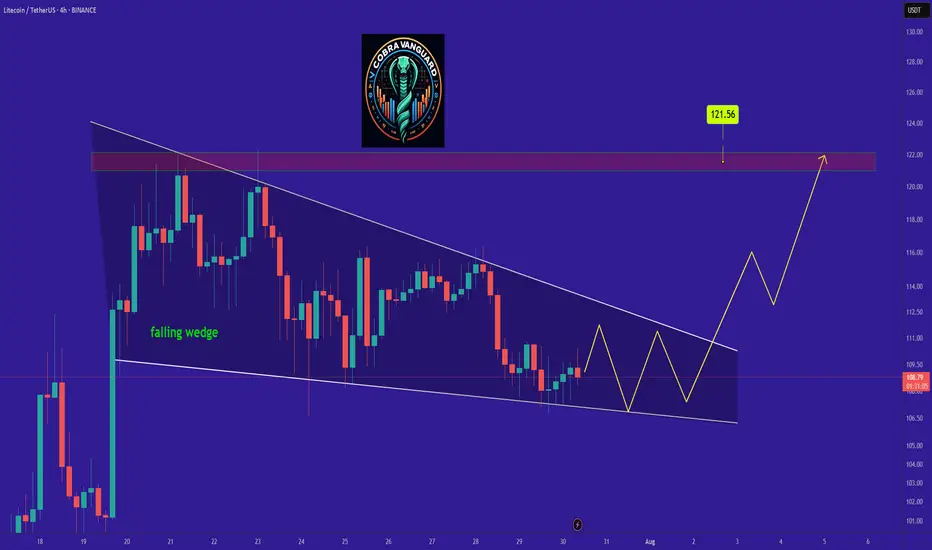
LTC is bullish now and many Traders don't see itSo if you pay attention to the LTC chart you can see that the price has formed a Ascending wedge which means it is expected to price move as equal as the measured price movement.( AB=CD )
NOTE: wait for break of the WEDGE .
Best regards CobraVanguard.💚
LTC/USDT- 4H Smart money grabbed the highs Price swept the buy-side liquidity, triggering stop orders above recent highs, then showed a strong rejection — indicating possible distribution.
Bearish divergence confirmed weakening momentum on the RSI.
Sell-side liquidity now becomes the primary draw, with the first target zone aligning near $106.

LTC/USD – Daily Timeframe - ShortLitecoin continues to move within a bullish wedge pattern, with price action respecting both the rising support trendline and the converging resistance line. Key support sits near $68–$70, while immediate resistance is around $80–$82.
If the wedge holds, consolidation could continue until around November, after which a breakout may trigger a stronger directional move. A break above resistance could open the way toward $88–$92, while a breakdown below support may retest the $62–$64 zone.
📌 Trade with care and always manage your risk. This is not financial advice.
Litecoin (LTC): Bearish until Fill of CME | After That We Buy Litecoin is under pressure by sellers, and we might be heading toward that bearish CME gap. Multiple trades that can be taken so keep your eyes wide open!
More in-depth info is in the video—enjoy!
Swallow Academy
