Can we be optimistic that this will come true? You might wonder why altcoins haven't experienced significant growth compared to Bitcoin. The answer lies in meme coins, as they have caused substantial harm to the market. How many cryptocurrencies do we really need? So, focus on the primary cryptocurrencies in this market. In my opinion, everything is beautiful for the first time, so only pay attention to Dogecoin among the meme coins.
Can we be optimistic that this will come true? If it follows the triangle pattern, the price will rise by $60.
Give me some energy !!
✨We spend hours finding potential opportunities and writing useful ideas, we would be happy if you support us.
Best regards CobraVanguard.💚
_ _ _ _ __ _ _ _ _ _ _ _ _ _ _ _ _ _ _ _ _ _ _ _ _ _ _ _ _ _ _ _
✅Thank you, and for more ideas, hit ❤️Like❤️ and 🌟Follow🌟!
⚠️Things can change...
The markets are always changing and even with all these signals, the market changes tend to be strong and fast!!
LTCUSDT trade ideas

LTC perfect buy setupHi crypto enthusiastic
LTC has a good opportunity for long and it can go up.
Everything is clear in the chart.
DYOR

LTC USDT💰 CRYPTOCAP:LTC USDT
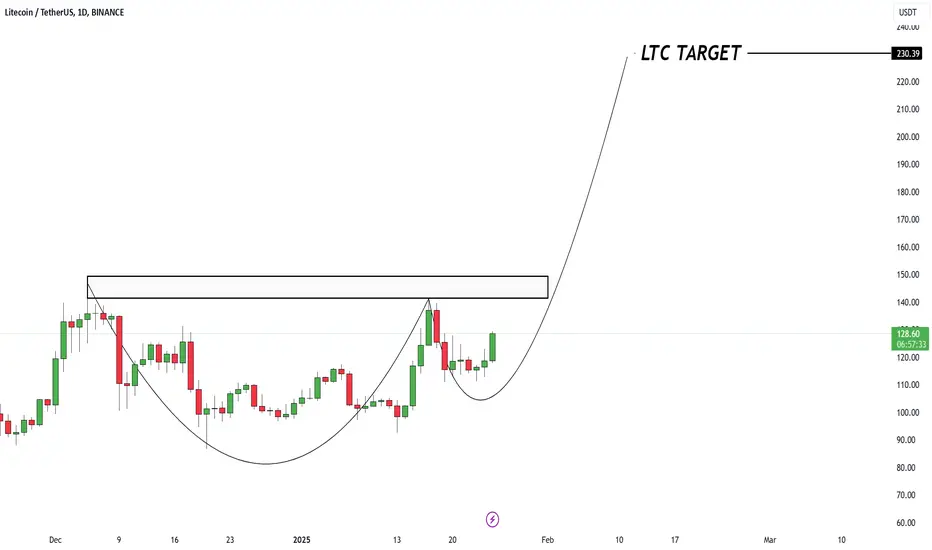
# LTC The Cup & Handle formation on the daily chart is signaling a powerful breakout 🐃
Strong resistance around $150 is the key level to watch before heading toward the target zone.
🎯 Target: $230.39
LTCUSDT 1-day analysis LTCUSDT 1-day analysis
1-day analysis of the strongest short-term support and sudden price increase of this cryptocurrency, this downward and upward swing has been repeated 2 times on the chart of this currency, indicating confirmation of this support area.
Sasha Charkhchian

Move to 138.47After breaking the resistance level of 116.18 with a spike and pullback to the level of 116, we expect a move to the level of 140 on the daily time frame.
Trade simply, the market is not complicated!

LTCUSDT: A Bullish Breakout on the Horizon?Yello, Paradisers! Are you ready for what could be a pivotal moment for #Litecoin? LTC is currently shaping up inside a textbook cup and handle pattern—one of the most reliable bullish setups. But will bulls have the strength to push past key levels and spark the rally, or will resistance hold firm? Let’s dive into the key levels and what you need to know.
💎At the moment, #LTCUSDT is resting on the 61.8% Fibonacci retracement level, which aligns with a strong horizontal support zone. This is an important level, as it serves as the foundation for the bulls to maintain their momentum. If this support holds, LTC is likely to stage a move higher.
💎Bullish momentum buildup will take price toward the neckline resistance between $140 to $145, a key zone that holds the breakout. If LTC breaks above the $145 resistance zone, it signals a breakout of the cup and handle pattern. This could open the doors for a powerful rally toward $168–$172, where the weekly timeframe resistance lies. However, this resistance is no joke—it’s a zone where reversals can occur, so be prepared for some turbulence.
💎Adding further support to the bullish case, LTC continues to gain strength from the EMA-250, which has been steadily guiding the price higher over the past several weeks. This trendline has been a key factor in maintaining upward momentum, giving bulls an additional edge in the current setup.
Patience and discipline are key here, Paradisers. The market often tests both bulls and bears before making decisive moves, so stay vigilant.
MyCryptoParadise
iFeel the success🌴

Litecoin (LTC) - Potential Bullish Breakout in the Next 48 HoursHello fellow traders!
This analysis outlines my outlook for Litecoin's price action over the next 48 hours, leading up to the reopening of traditional stock markets on Monday. I'm anticipating a potential upward move, and here's my rationale:
Current Setup:
I've identified a potential bullish setup on the Litecoin ( BINANCE:LTCUSDT LTC/USDT) chart. Based on my analysis, I've placed a buy stop order at $127.50 . This means that my long position will be automatically triggered if the price reaches this level.
Target Levels:
If the price breaks through the $127.50 level and activates my order, I have two primary price targets in mind:
Target 1: $145.00
Target 2: $165.20
Leverage:
I'll be using 8x leverage for this LTC/USDT trade, amplifying both potential gains and losses.
Important Considerations:
* I'm using a buy stop order as it allows me to enter the market only when the price is going up.
* I have set two targets as they are the resistance levels that the price is likely to go towards.
* Remember, using leverage magnifies your risk. Manage your position size accordingly and only risk what you can afford to lose.
Disclaimer:
This is my personal analysis and not financial advice. Always conduct your own research and due diligence before making any trading decisions. Cryptocurrency markets are highly volatile, and past performance is not indicative of future results.
I wish you all profitable trades!

New Rally Will Come Earlier in Feb ! Lets Begin our New Journey As you heard about Trump's New Commands about Crypto Market and if BTC point of view goes as a Gold for treasury, LTC will Gain So much for transferring BTCs of ETF and Governments, cause it is one of chippiest network for transferring Bitcoin in least amount of time.

LITECOIN isnt light anymore. STOP IT. Get some Help.Because he is heavy for your shorts.
Please understand his emotions
His actions
and dont forgive
I dont know what i am writing pretty obvious to see my charts to understand!

Trade Setup: LTC Long Opportunity Market Context:
LTC experienced a significant rally last week, showcasing strong bullish momentum. The price has since retraced to a key support zone, offering a strategic entry point for a long spot trade.
Trade Details:
Entry Zone: $110.00 - $115.00
Take Profit Targets:
$136.50 - $140.00
$165.00 - $175.00
Stop Loss: Below $105.00
This setup leverages the retracement into support, aligning with the broader bullish trend for LTC. 📈

LTCUSDT - ASCENDING BREAKOUT FORMATION ?
LITECOIN (LTC/USDT) Technical Analysis
Pattern: Long-term ascending triangle formation with clear demand zone between 85-95 USDT
Key Points:
- Price currently at 116.25 USDT (-0.80%)
- Strong demand zone established
- Two major price targets identified: TP1: 188 USDT, TP2: 205 USDT
- Volume showing increased interest at 117.82K
Technical Setup:
1. Support: Ascending trendline from November lows
2. Resistance: Horizontal line around 130 USDT
3. Market structure suggests accumulation phase before potential breakout
Risk Management:
- Entry: Current levels after confirmation of demand zone hold
- Stop Loss: Below demand zone (~78 USDT)
- Risk/Reward ratio favorable for long position
Important: This analysis is for educational purposes. Always conduct your own research and manage risk appropriately.
#Litecoin #LTCUSDT #CryptoTrading #TechnicalAnalysis

#LTC/USDT Analysis📉 #LTC/USDT Analysis📉
CRYPTOCAP:LTC is respecting the diagonal trendline on the 4H timeframe.
👀 Watching for shorts around the 4H bearish OB with confirmation.
📌 Resistance: PMH $147.24
📌 Support: PWL $92.42

LITECOIN BULLISH ?LTC bearish trend in daily is broken and reaching good PRZ to go upside.
Pullback is going to complete.

LTC Breaking the Wedge Path to $150+Pattern
The price is confined within a falling wedge, gradually narrowing towards the apex.
Current Situation
The price is testing the upper trendline, indicating an attempt at a breakout.
Potential Action
A confirmed breakout will be signaled if a 4-hour candle closes above the trendline.
Target
A breakout from the wedge could drive the price towards $150+, as the wedge's height suggests potential upward movement.
Stop-Loss
Placing a stop-loss below the recent swing low or the wedge's lower boundary can manage downside risk.
This setup suggests waiting for confirmation before entering a long position to capitalize on the expected bullish momentum.

LTC 4H SPOTLTC 4H SPOT
.
Market Order Allowed
TP SL On Your Own
LTC is One of Slow Moving Coin
.
CP: 119.XX

LTC - Loads more up to goI've had a lot of requests for custom analysis on LTC. Its looking strong within the channel and there's potential for lots more up to complete the X wave, which would still look corrective in a very straightforward looking ABC. I actually don't like LTC too much. It's slow, sluggish, doesn't keep up with market trends. But, it's looking strong for some more up. Follow and share for more.

Solana (SOL) Trade Update: Breakout Success and Profit BookingTitle: SOL/USDT Breakout Success | Profit Booked at $260
Description:
This video covers my recent trade on SOL/USDT, where I capitalized on a strong breakout above key resistance levels. After identifying a clear bullish structure supported by volume and momentum, I entered the trade and booked profit at $260. The price aligns well with the 1.618 Fibonacci extension, validating the analysis.
Key Highlights:
Breakout Confirmation:
SOL broke out of the descending triangle pattern with significant volume.
Strong bullish candle closures confirmed the breakout.
Momentum Indicators:
RSI in the overbought region indicates strong upward pressure.
ADX confirmed a strengthening bullish trend.
Profit Booking:
Exited at $260 as price approached key resistance near the Fibonacci target.
Support Levels to Watch:
$226.6 for potential pullbacks and re-entry zones.
Market Context:
Bitcoin's bullish trend further supported the SOL breakout, boosting confidence in the trade.
Conclusion:
This trade demonstrates the power of aligning technical analysis with momentum and volume. Watch the video for detailed insights, including entry, exit, and post-trade analysis. Feel free to share your feedback and ideas!

TradeCityPro | LTCUSDT Potential Approval of ETFs👋 Welcome to TradeCityPro Channel!
Let’s delve into the analysis of LTC, one of the oldest coins in the market. Recently, there have been rumors about its potential inclusion in ETFs, which could attract a good amount of capital and lead to promising movements in the future.
🌐 Overview Bitcoin
Before starting today’s altcoin analysis, let’s look at Bitcoin on the 1-hour timeframe. Since yesterday, Bitcoin experienced a correction, which was necessary for the market, and it pulled back to the 102135 range. The next trigger for a long position will be a breakout above 104714.
Yesterday’s correction, coupled with an increase in Bitcoin dominance, caused noticeable declines in some altcoins. This highlights the importance of monitoring BTC pairs in your checklist these days.
📊 Weekly Timeframe
In the weekly timeframe, Litecoin’s chart reminds me of forex charts because it’s one of the oldest coins that has survived and spent a significant amount of time in a ranging market.
As a reminder, don’t develop emotional attachments to your coins. Don’t assume that any coin is guaranteed to rise. We are here to trade and improve our lives through trading. The chart is what matters. Many coins that were in the top 10 during previous bull runs no longer exist, and Litecoin remains due to its role as a payment coin.
If you entered at the 75.91 breakout trigger, I suggest holding your position for now. It seems like the news of ETF approval is being priced in, but be aware of the risk and continue holding. Breaking the 135.55 trigger will be challenging.
For a new buy entry, the current trigger is the 135.55 breakout. Until the price drops below 47.19, holding is a viable option. Personally, I wouldn’t buy into it, as even the founders of this project seem to have abandoned it.
📈 Daily Timeframe
In the daily timeframe, Litecoin shows an upward trend. After breaking the 74.72 resistance (the top of its daily box), it moved far from it without even a pullback, indicating its relative strength compared to other altcoins.
Following the 74.72 breakout, the price reached the critical weekly resistance of 136.97 and then corrected to 97.91. Drawing a Fibonacci retracement reveals that the 97.91 support aligns with the 0.382 Fibonacci level. A breakout from this level could spark a sharp new upward movement.
Currently, the price is below the critical 136.97 resistance. Buying after a breakout here would be logical and worth the stop-loss risk. Given the recent strong volume, a breakout above 136.97 with a stop-loss at 97.91 is a reasonable entry strategy.
In case of a drop, the price could pull back to the 116.76 level initially and potentially further to 97.91. However, momentum would likely weaken at this point. If 97.91 breaks, deeper corrections could occur, targeting 83.53 and 74.22, though a drop below 97.91 seems unlikely for now.
⏱ 4-Hour Timeframe
In the 4-hour timeframe, after a false breakout below the 97.91 support, Litecoin began a sharp upward movement, shifting its cyclical trend in this timeframe.
📈 Long Position Trigger
I plan to open a futures position after a breakout above 137.99 or earlier if I observe strong momentum. I’ve partially locked in profits from my entry at 104.95.
📉 Short Position Trigger
I won’t consider it as long as the price stays above 115.42 unless the price forms lower highs and lows. Even then, I’d focus on coins still in their daily range boxes rather than those with an upward trend like this one.
📝 Final Thoughts
Stay calm, trade wisely, and let's capture the market's best opportunities!
This analysis reflects our opinions and is not financial advice.
Share your thoughts in the comments, and don’t forget to share this analysis with your friends! ❤️

LTC/USDTKey Level Zone: 122.50 - 125.50
HMT v4.1 detected. The setup looks promising, supported by a previous upward/downward trend with increasing volume and momentum, presenting an excellent reward-to-risk opportunity.
HMT (High Momentum Trending):
HMT is based on trend, momentum, volume, and market structure across multiple timeframes. It highlights setups with strong potential for upward movement and higher rewards.
Whenever I spot a signal for my own trading, I’ll share it. Please note that conducting a comprehensive analysis on a single timeframe chart can be quite challenging and sometimes confusing. I appreciate your understanding of the effort involved.
Important Note :
Role of Key Levels:
- These zones are critical for analyzing price trends. If the key level zone holds, the price may continue trending in the expected direction. However, momentum may increase or decrease based on subsequent patterns.
- Breakouts: If the key level zone breaks, it signals a stop-out. For reversal traders, this presents an opportunity to consider switching direction, as the price often retests these zones, which may act as strong support-turned-resistance (or vice versa).
My Trading Rules
Risk Management
- Maximum risk per trade: 2.5%.
- Leverage: 5x.
Exit Strategy
Profit-Taking:
- Sell at least 70% on the 3rd wave up (LTF Wave 5).
- Typically, sell 50% during a high-volume spike.
- Adjust stop-loss to breakeven once the trade achieves a 1.5:1 reward-to-risk ratio.
- If the market shows signs of losing momentum or divergence, ill will exit at breakeven.
The market is highly dynamic and constantly changing. HMT signals and target profit (TP) levels are based on the current price and movement, but market conditions can shift instantly, so it is crucial to remain adaptable and follow the market's movement.
If you find this signal/analysis meaningful, kindly like and share it.
Thank you for your support~
Sharing this with love!
HMT v2.0:
- Major update to the Momentum indicator
- Reduced false signals from inaccurate momentum detection
- New screener with improved accuracy and fewer signals
HMT v3.0:
- Added liquidity factor to enhance trend continuation
- Improved potential for momentum-based plays
- Increased winning probability by reducing entries during peaks
HMT v3.1:
- Enhanced entry confirmation for improved reward-to-risk ratios
HMT v4.0:
- Incorporated buying and selling pressure in lower timeframes to enhance the probability of trending moves while optimizing entry timing and scaling
HMT v4.1:
- Enhanced take-profit (TP) target by incorporating market structure analysis

LTC Trade Zones: Short or Long?LTC has been making some moves recently, with a solid rise getting close to a key high. But the current price action hints at an ABC corrective structure, so a pullback could be on the way.
Short Setup:
Entry: Between the 0.618 and 0.786 Fibonacci retracement of the current wave
Stop Loss: $141.4 (the previous high)
Target: $130.7
R:R: About 2:1
Long Setup:
Entry: Around $130, with confirmation
Stop Loss: $126.45
Targets:
First at $134
Second at $147 (the key high)
R:R: A nice 5:1 potential
Why These Levels?
The $130 support zone lines up with the 1:1 Trend-Based Fibonacci Extension ($130.29)
It’s also near a previous swing high, adding more weight to it as a strong level
Plan:
If price moves into the retracement zone, a short trade targeting $130 makes sense
If it hits the $130 support and shows strength, a long setup targeting $134 and $147 could be a great play

Be Lite with LiteCoin - LTC xDI have drawn a smol snake on the chart, That is surely the 7SMA lol, The breaking of that would make the cyan box in place where you can plan next buys for LTC.
I am such a good artist oohhh

LTCUSDT on the Rise: Major Breakout Signal!!MARKETSCOM:LITECOIN ( BINANCE:LTCUSDT ) has broken out of a major resistance level with strong volume, indicating renewed bullish momentum. This breakout marks the start of a potential uptrend, as BINANCE:LTCUSDT shows strength above the critical zone.
If the price holds above this resistance level, we could witness further upside movement, potentially challenging and even surpassing its previous all-time high. With increasing market interest, LTC might just be gearing up for a remarkable rally.
BINANCE:LTCUSDT Currently trading at $130
Buy level: Above $115
Stop loss: Below $85
Target : $410
Max Leverage 3x
Always keep Stop loss
Follow Our Tradingview Account for More Technical Analysis Updates, | Like, Share and Comment Your thoughts

Long idea on $LTCI think the daily altcoin will follow Bitcoin, which will give a good opportunity to take a long from low values, risk 1 to 8
