#LTCUSDTDate: 03-08-2025
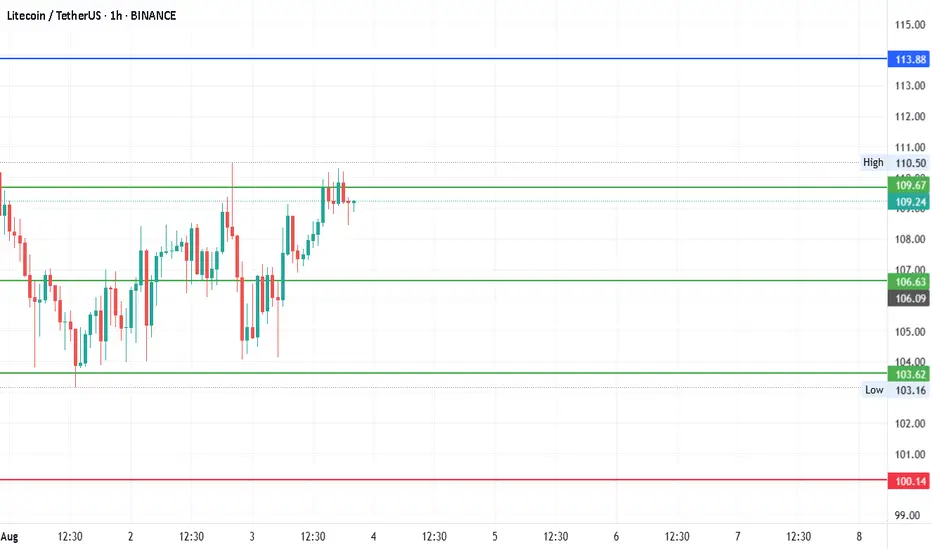
#LTCUSDT - Current Price: 109
#LTCUSDT Pivot Point: 107 Support: 104 Resistance: 110
#LTCUSDT Upside Targets:
Target 1: 113
Target 2: 117
Target 3: 120
Target 4: 124
#LTCUSDT Downside Targets:
Target 1: 100
Target 2: 97
Target 3: 93
Target 4: 89
#Crypto #Bitcoin #BTC #CryptoTA #TradingView #PivotPoints #SupportResistance
#TradingView #Nifty #BankNifty #DJI #NDQ #SENSEX #DAX #USOIL #GOLD #SILVER
#BHEL #HUDCO #LT #LTF #ABB #DIXON #SIEMENS #BALKRISIND #MRF #DIVISLAB
#MARUTI #HAL #SHREECEM #JSWSTEEL #MPHASIS #NATIONALUM #BALRAMCHIN #TRIVENI
#USDINR #EURUSD #USDJPY #NIFTY_MID_SELECT
#SOLANA #ETHEREUM #BTCUSD #MATICUSDT #XRPUSDT #LTCUSDT
LTCUSDT trade ideas
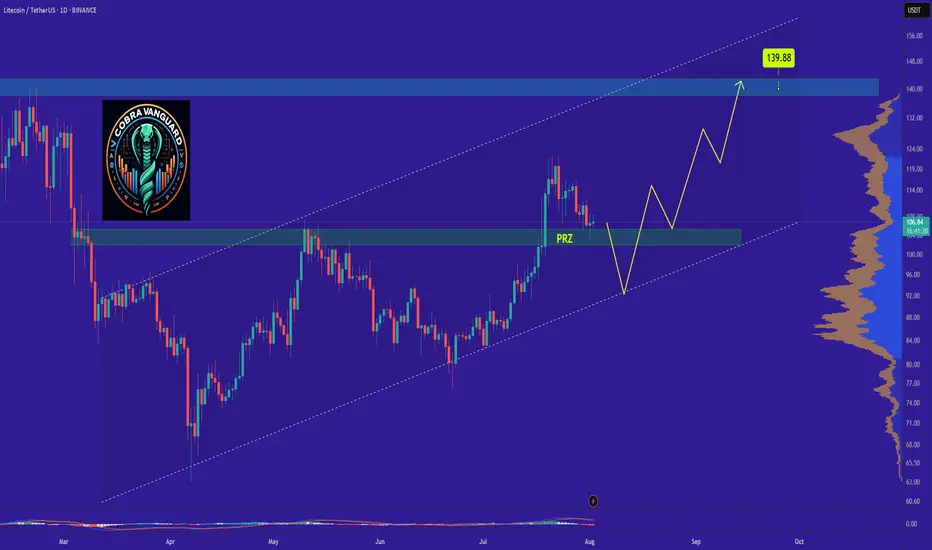
LTCs Situation (Daily) !!!If the price loses the PRZ range, it will drop to the bottom of the channel and then rise to the top of the ascending channel, which will take some time.
Best regards CobraVanguard.💚
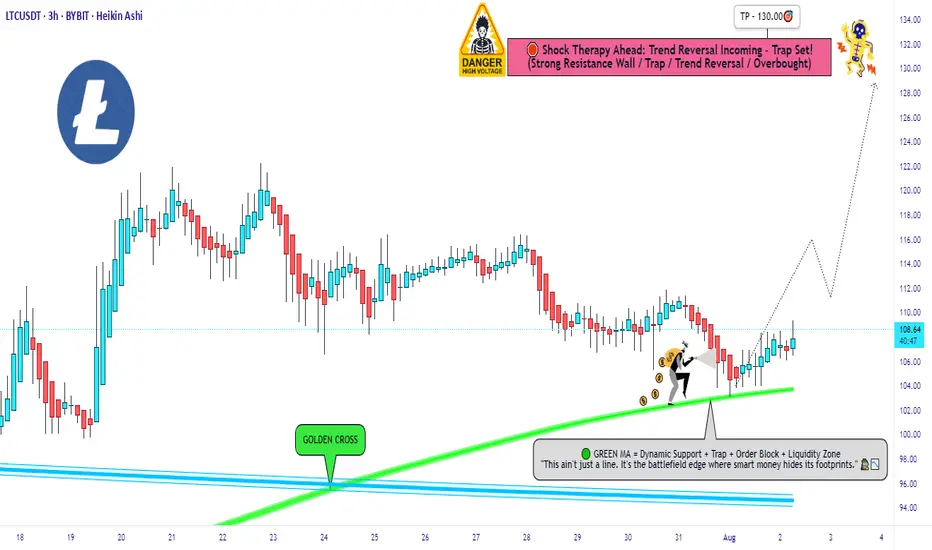
LTC/USDT Robbery Underway | Bullish Setup, Get In Now!🔥💎 LTC/USDT HEIST PLAN: ROB AT ANY PRICE! 💎🔥
🚨 Bullish Move Incoming | Layered Entries | Thief Trader Exclusive 🚨
🌟Hi! Hola! Ola! Bonjour! Hallo! Marhaba!🌟
Dear Money Makers & Market Robbers, 🤑💰💸✈️
The time has come for another high-stakes Thief Trading heist, and this time we're lockin' in on LTC/USDT – aka "Litecoin vs Tether" 💣💸
🎯 Thief’s Mission Plan: BULLISH AT ANY PRICE LEVEL!
We're going full stealth mode with a layering strategy — stacking multiple limit orders like a true pro thief preparing for a clean escape! 🔪📉📈
🚪 ENTRY: "Anywhere, Anytime" 🚪
📈 Buy from any price level — but for optimal entry:
🟢 Use Buy Limit orders near recent lows (15-30 min TF)
🔔 Don’t forget to set alerts for breakout confirmation!
🛑 STOP LOSS: Strategic Defense 🛑
🗣️ "Listen up, team! Stop loss ain’t a maybe — it’s your armor. Place it smart, or prepare for pain." 🔥
📍Recommended SL: 100.00
🔐 Adjust based on your lot size & how deep you stack your orders.
🏁 TARGET: 130.00 🏁
💸 But always Escape Early if the plan gets too hot!
Use a Trailing SL to lock in gains and slip out clean 😎🧨
🧠 PRO TIPS from the THIEF:
🔎 Only Buy. No Shorting!
💣 Scalpers: Jump in with the trend, not against it.
🧲 Swing Traders: Stay patient, and execute the full heist.
🚀 Use Trailing Stops – Let profit ride, but stay protected!
📢 MARKET INSIGHT:
🔥 Bullish Bias backed by:
✅ On-Chain Metrics
✅ Sentiment Shifts
✅ Macro Flows
✅ COT Reports
✅ Intermarket Divergence
⚠️ TRADING ALERT: Stay Sharp!
📰 News Events = Volatility.
💡 Avoid fresh entries during high-impact events.
📉 Use Trailing SL to secure your running trades.
💖 SUPPORT THE CREW 💖
🚀 Smash that Boost Button if you believe in the Thief Style Strategy
👑 Let's rob the market together, one level at a time.
🧠 Stay sharp, stay sneaky – and I’ll see you at the next target 🎯
— Thief Trader 🐱👤💰🚁🌍
Litecoin long to $130 area today!Just now opened a new long position on litecoin.
Sl: 122.09 or lower
Aiming for $130 area. Scaling out. Based on my DTT analysis- Direction target and timing bottom of correction is probable in this area.
Trend is bullish and likely to continue for new highs.
2.82-3.12 RR
Time sensitive

Ltc long to $130Just now opened a long position on litecoin. Aiming for $130. Anticipating that market will likely start pumping back up next hr. If not I might exit.
sl: 121.25
2RR+

Litecoin LTC price analysisToday we will analyze the third candidate for ETF in the near future is CRYPTOCAP:LTC
An old coin, good fundamentals, 1:1 tokenomics like CRYPTOCAP:BTC but 4 times more coins, untapped potential, and the list goes on...
♎️ The main difference from the previous two candidates is the current market cap of the coins: CRYPTOCAP:XRP - $118 billion, CRYPTOCAP:SOL - $72 billion, #Litecoin only $6 billion
Accordingly, the prospects for growth in the price of OKX:LTCUSDT are many times greater
🔥 Currently, #LTCUSD price is near the potential purchase zone of $71.25-76.25
📈 Growth potential of at least $170-180
🐻Critical level of $67
_____________________
Did you like our analysis? Leave a comment, like, and follow to get more

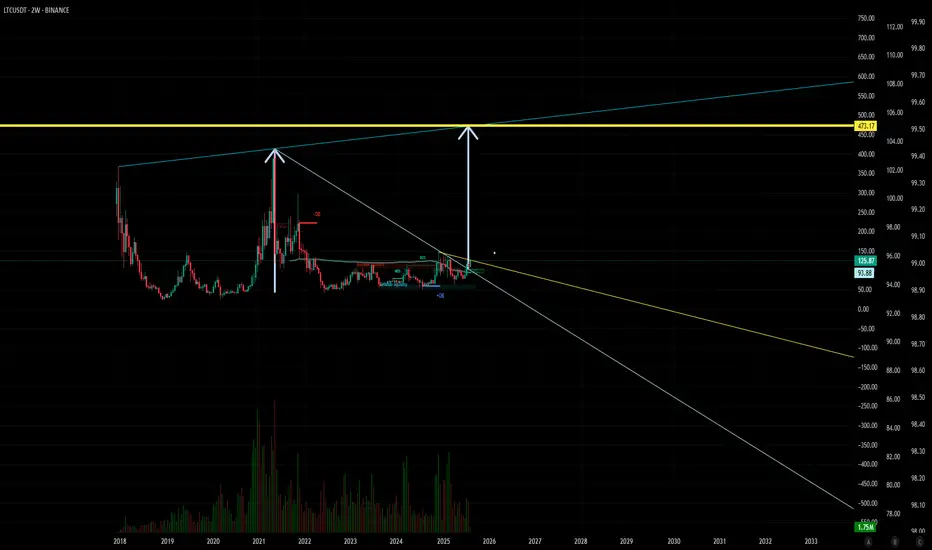
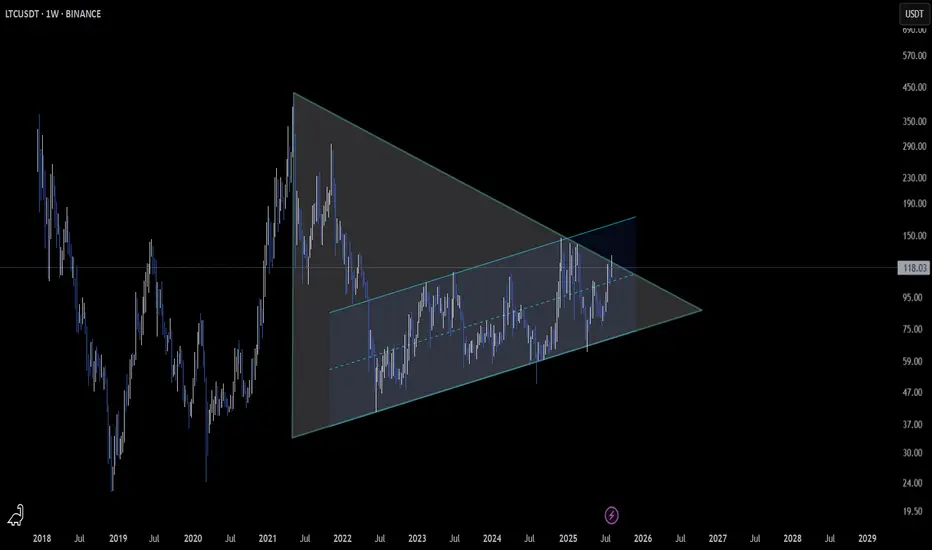
473$$$LTC/USDT Technical Analysis: Bullish Breakout Targeting $473.17
This chart presents a long-term bullish forecast for Litecoin (LTC/USDT) on the 2-week timeframe. The analysis suggests that LTC is on the verge of completing a multi-year consolidation pattern, with a potential for a significant upward price movement.
Key Observations:
Macro Symmetrical Triangle: The chart highlights a massive symmetrical triangle pattern that has been forming for approximately seven years (from 2018 to 2025). This pattern is defined by a descending trendline connecting the major highs and an ascending trendline connecting the major lows, indicating a long period of price contraction and energy accumulation.
Bullish Breakout: The analysis projects a breakout from the upper resistance of this triangle around mid-2025. A breakout from such a long-term consolidation pattern is considered a powerful bullish signal, suggesting the end of the sideways/downtrend and the beginning of a new major rally.
Price Target Activated: The primary target for this bullish move is set at $473.17. This price level corresponds to the historical all-time high of May 2021. After a major pattern breakout, it is common for price to target previous significant highs where "buyside liquidity" is presumed to rest. The text "473 target activated" implies that the breakout event is the trigger that sets this price objective in motion.
In summary, the chart illustrates a scenario where LTC breaks out of a multi-year consolidation, leading to a powerful rally with the ultimate target of reclaiming its previous all-time high of $473.17.
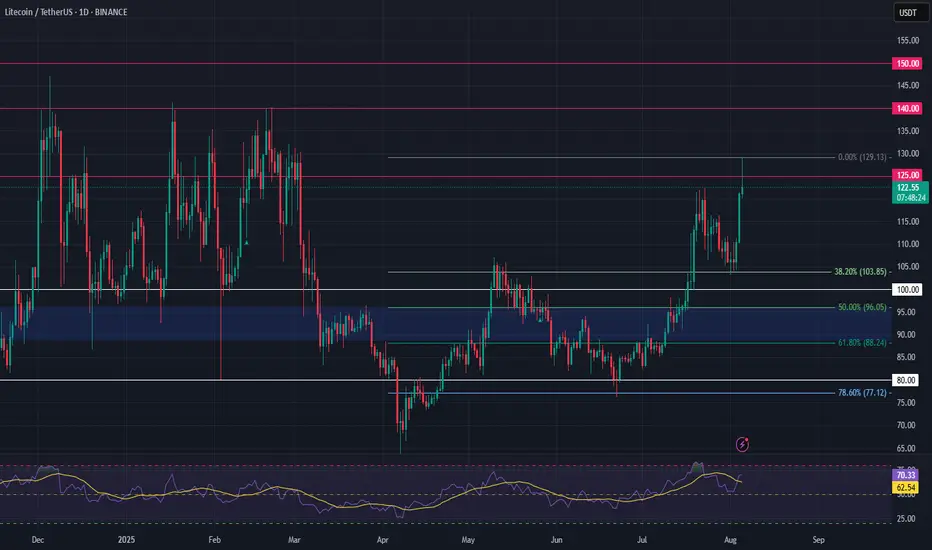
Litecoin short Litecoin (LTC/USDT) Short Trade Thesis – August 2025
Trade Setup:
Entered short position at $125.
Stop loss set at $138.5 (above key resistance/swing high).
Gradually taking profits, staging exits down to $88.
Thesis & Rationale:
Price has reached a major supply/resistance zone between $127–$130, where historic rejections have occurred.
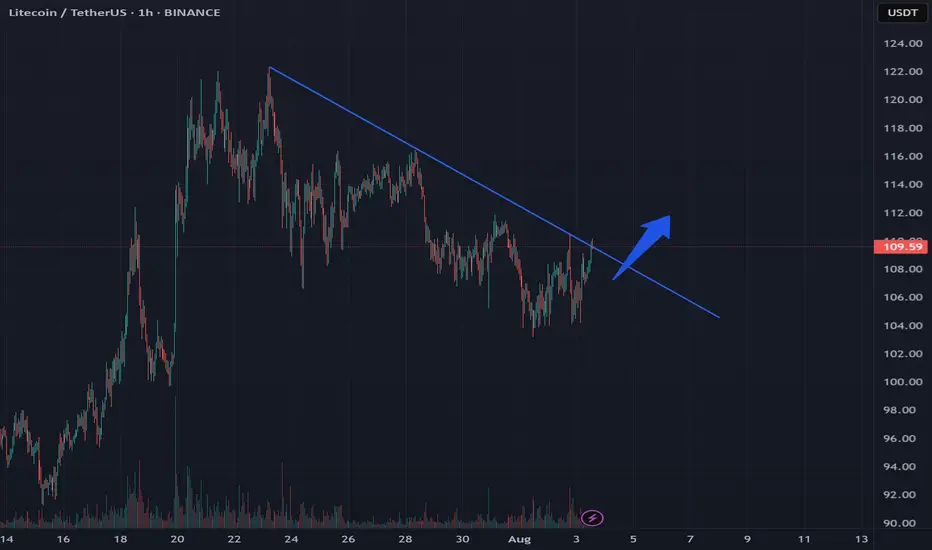
Daily chart reveals a persistent downtrend line since December 2024, forming a series of lower highs (strong bearish market structure).
Multiple failed breakout attempts above this trendline highlight ongoing selling pressure.
Fibonacci retracement levels (e.g., $116, $109, $102) provide step-down profit-taking targets, with $88 as the primary support zone.
Technical Confluence:
RSI and momentum indicators are showing signs of exhaustion but have not fully flipped bearish yet; move is anticipated when momentum shifts.
Volume profile above $129 is thin, suggesting limited liquidity and increased risk of swift rejection.
Recent liquidation and open interest data indicate crowded long positioning—raising odds of a corrective move downward.
Market Context:
Broader crypto sentiment is mixed; while bullish headlines persist, altcoin rallies look extended.
If Bitcoin remains stable or corrects, tailwinds could intensify the LTC downside move.

Litecoin (LTC) – Re-Entry After 44% RallyLTC rallied over 44% since our last trade setup. Now, we’re looking for a re-entry opportunity as the broader crypto market shows signs of a potential pullback.
🔍 Setup Overview:
Entry Zone: $108 – $103
Take Profits: $125 / $140 / $150
Stop Loss: Daily close below $100
Bias: Bullish continuation (as long as structure holds)
🧠 Trade Idea:
Expecting a possible sweep of the $104 low before upside resumes. Key condition: Daily candle must not close below $100—wicks are fine. If price respects this level, the bullish structure remains intact.
This is a classic liquidity grab scenario. Entering in the $108–103 zone allows favorable risk-to-reward if LTC catches support and reclaims momentum.
⚠️ Invalidation:
If LTC posts a daily close below $100, trade setup becomes invalid. Monitor price action closely around this key support zone.
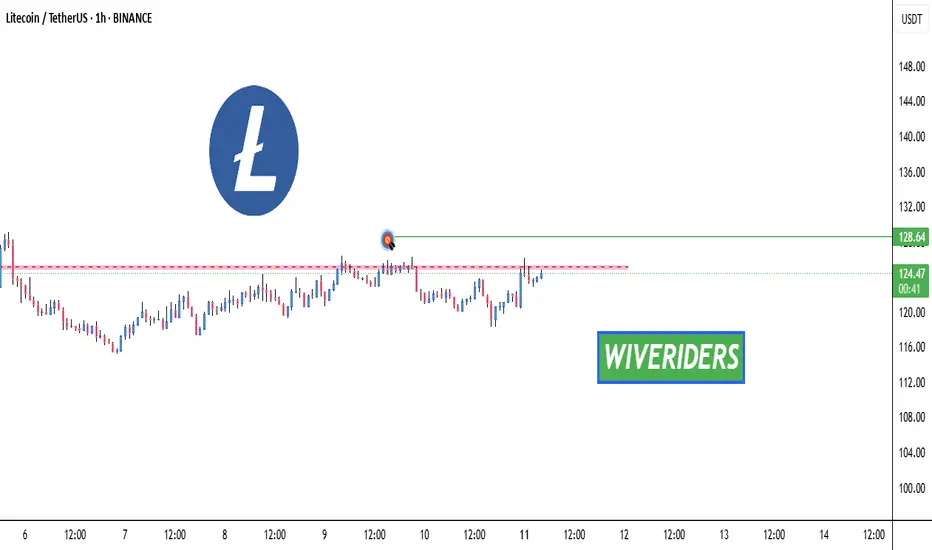
LTC Breakout Watch – Red Resistance Being Tested! 🚨 LTC Breakout Watch – Red Resistance Being Tested! 🔴⏳
LTC is testing the red resistance zone.
📊 If breakout confirms, next move could target:
🎯 First Target → Green line level
A breakout could trigger bullish continuation and upside momentum.
LTCUSDT 4H CHART ANALYSIS.Structure: Market is in a bullish trend, forming higher highs and retracing after a strong impulse move.
Liquidity Sweep (SSL): Recent candles show a sweep of sell-side liquidity, targeting the lows near $108, clearing out weak longs.
FVG (Fair Value Gap): Price is approaching a 4H imbalance zone ($104–$108), indicating an inefficiency that may attract buy orders.
POI & OB Zone: A Point of Interest (POI) and a Bullish Order Block (OB) rest just below FVG (around $102–$104), acting as a strong confluence for reversal.
Expectations: If price fills the FVG and reacts from POI/OB with a bullish engulfing or confirmation, we can expect a bounce targeting the previous high around $125+.
Ideal Setup: Look for entry around $102–$106, with SL below OB and TP 1.5–2x above previous high.
This setup aligns with Smart Money Concepts (SMC) – liquidity sweep, FVG fill, and OB reaction. ✅

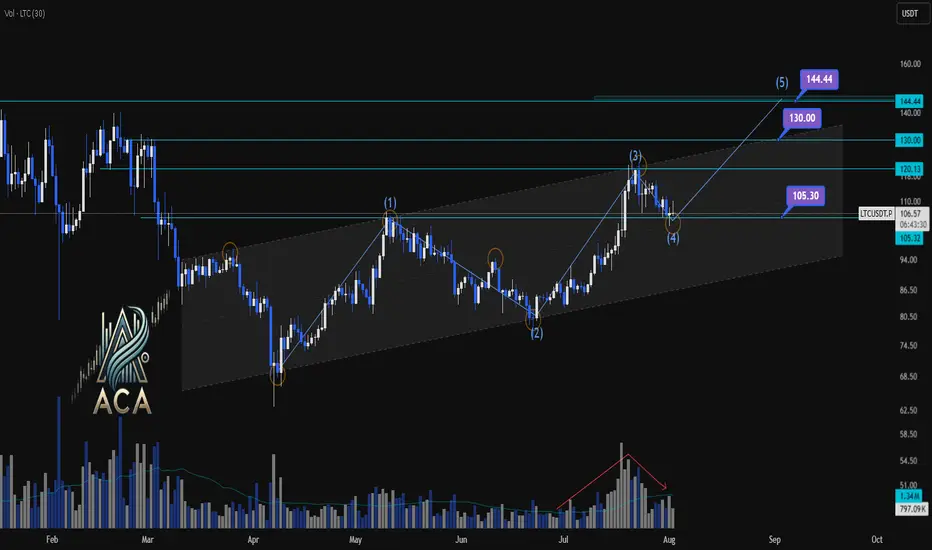
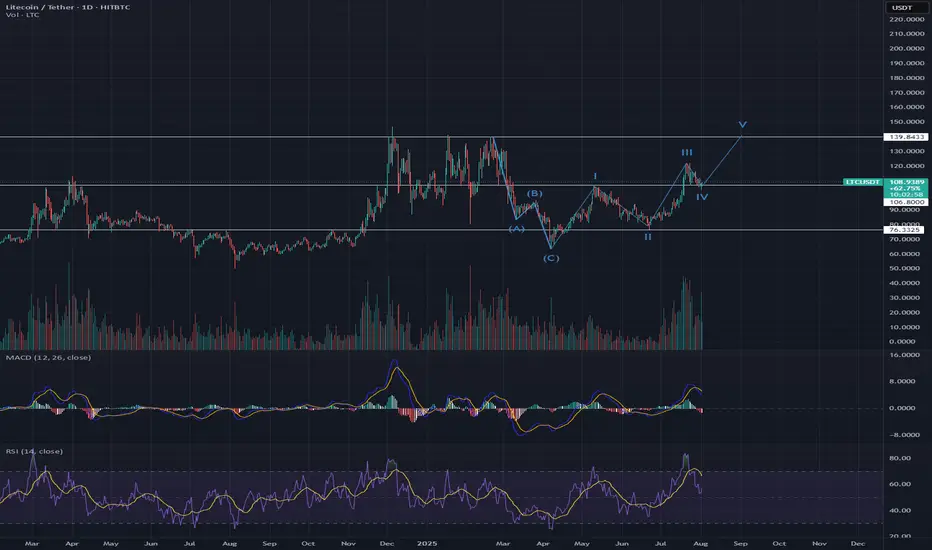
LTCUSDT | Daily Chart Analysis | Bullish Structure UnfoldingLTCUSDT | Daily Chart Analysis | Bullish Structure Unfolding
🔍 Let’s break down LTC/USDT’s technical setup, focusing on volume, Elliot Wave structure, and key target levels for this bullish scenario. If you're following this channel, be sure to react and let us know your thoughts on the roadmap!
⏳ Daily Overview
LTCUSDT is moving within a defined ascending channel, supported by increasing bullish momentum and clear Elliot Wave progression. The recent wave count points to a textbook impulse, setting up the next key move.
🔺 Long Setup:
The market has completed Waves (1) through (4), and we’re now looking at the development of Wave (5) to the upside.
- Wave (5) Target Zones:
- $130.00
- $144.44
These are the next resistance levels based on previous highs and channel dynamics.
- Key support to watch:
- $105.30 — this zone may act as a springboard for the next rally if tested.
📊 Key Highlights:
- Volume has shown a clear bullish divergence as price advances, signaling growing interest and strength heading into Wave (5).
- The bullish channel remains intact, and each dip has been met with higher lows, confirming the ongoing uptrend.
- Elliot Wave structure suggests further upside, with the $130.00 and $144.44 levels as potential targets.
🚨 Conclusion:
LTC bulls should keep an eye on price action as it approaches support at $105.30 — a bounce here could ignite the next leg higher toward our target zones. Reaction from the channel community will be crucial as Wave (5) unfolds. Show your support with a reaction below if you’re riding this wave!
LTC Forms Triangle Pattern Signaling Potential BreakoutLTC is currently forming a triangle pattern on the 4-hour time frame. A break of the upper trend line may indicate an exit from the support zone. Based on historical dynamics, such breaks often lead to upward momentum with a higher probability.
Current price: $108.12
With a higher probability, the price can reach the marks of $111 to $115
The price can also touch the lower marks of $105.4
This analysis is based on the technical pattern and also incorporates AI to provide more accurate results.
LTC long turm Accroding to VSFA+ A.o.A All
Accroding to VSFA+ Strategy, LTCusdt long trum dump expected

LtcLtc lproject looks promising
Solid owners who define the true value of crypto
I don’t see any reason this turns bearish anytime soon

LTCUSDT:Elliot Wave Analysis Hello friends we see the chart of LTCUSDT , elliot analysis, the end of 5th of C wave at 138$ and I expected start the correction wave

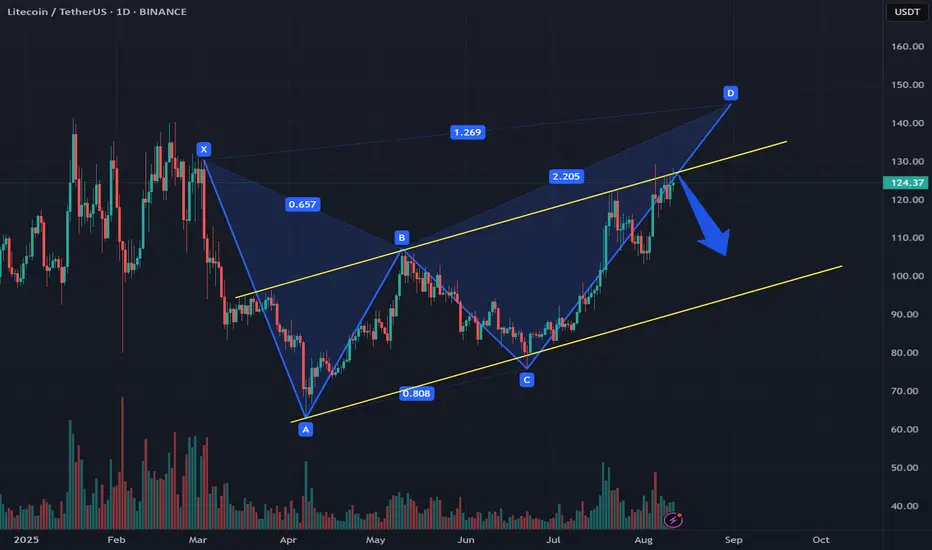
LTC Annual Chart Shows Bearish Butterfly Pattern Near CompletionOn the annual timeframe of the LTC chart, the Butterfly (bear) pattern has almost formed. This pattern indicates a change in trend
We have also reached the upper limit of the global ascending corridor
As a result, according to this pattern, a downward movement is expected
Current price: $125.28
Expected movement according to the patterns, in the range of $117 or $107
Also in this pattern, a breakout of the corridor at the level of $133 is possible

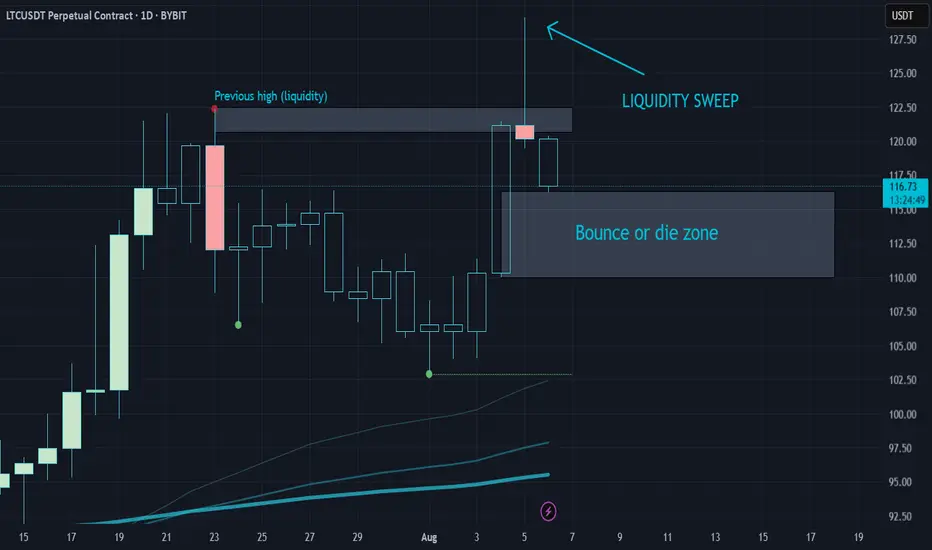
Litecoin cleared the previous high liquidity and now is losing sIf CRYPTOCAP:LTC doesn't bounce from this area, the most likely outcome is that it reverts the whole pump.
Litecoin cleared the previous high liquidity and now is losing steam, doing what it likes to do:
Mean revert pumps.
LTC Eyes Multi-Timeframe Breakout Zones📆 On the weekly chart, CRYPTOCAP:LTC is pushing against the upper boundary of a long-term symmetrical triangle 🔺 — a breakout here could set the tone for the months ahead.
📅 Meanwhile, the daily structure remains intact inside an ascending channel 📈, with price hugging the trendline and respecting the range so far.
The next major move hinges on whether LTC can break through these converging resistance levels or face rejection.
👀 Key structure in play — breakout traders, keep this one on watch!
Not financial advice. BINANCE:LTCUSDT
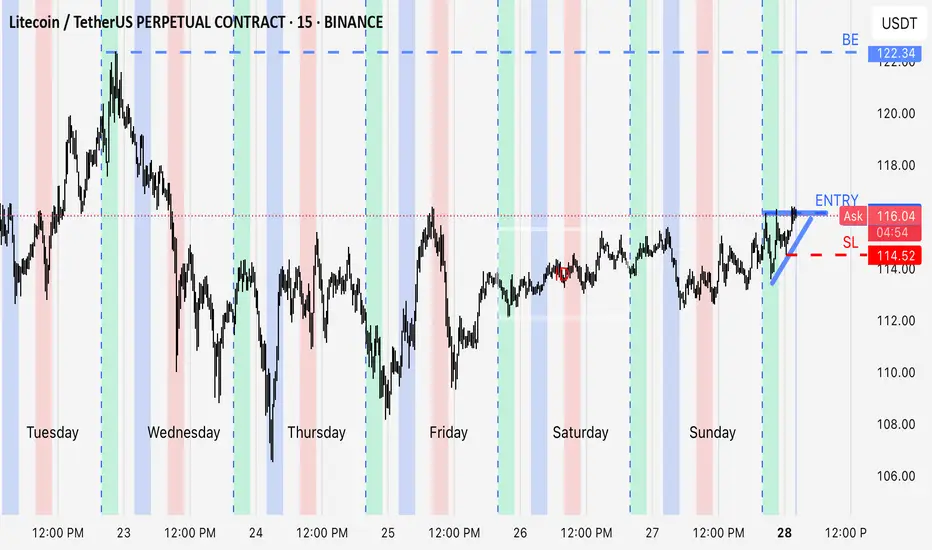
inside day breakoutLooking for a quick parabolic trade. Builded up from Asia and the gap time , supported by 20ma. On the daily it is bouncing of a 50% of a strong bullish move. This could be a really big R:R trade . Even 1:10 is possible. Looking to hold till close and breakeven if opportunity presents
Litecoin (LTC): Looking Bad Now, But Has Good Potential Litecoin is in bad shape, where sellers are showing pressure, which could lead to bigger downward movement.
Despite that, we are still above the local neckline area, so we are still bullish, for now!
More in-depth info is in the video—enjoy!
Swallow Academy
