LTCUSDT - Ascending TriangleThe pair is moving in an ascending channel. The trade can be taken as there is no divergence on the pair.
LTCUSDT trade ideas

LTC📊Analysis by AhmadArz:
🔍Entry: 87.60 - 86.06
🛑Stop Loss: 89.56
🎯Take Profit: 83.88 -80.83 -78.95 -76.40
🔗"Uncover new opportunities in the world of cryptocurrencies with AhmadArz.
💡Join us on TradingView and expand your investment knowledge with our five years of experience in financial markets."
🚀Please boost and💬 comment to share your thoughts with us!

LTCUSD 1WLTC ~ 1W 📈
#LTC Continue to maintain the support line in this pattern. It seems attractive to make purchases every time it touches this Support Line.

LTC | LTCUSDT | LITECOIN idea - key level $89LTC | LTCUSDT | LITECOIN idea - key level $89
Ltc closing and opening above 89 can send it to $119
keep 87sl once open above White POC

LTC Currency Analysis Weekly Timeframe for UpsideThe LTC currency has been accompanied by good news in the past months and has not grown as expected. Now we have entered an upward cycle and it will be a good option for long-term investment.

LTC long Litecoin broke through the descending trendline. The bullish movement to the resistance level at $98 is expected to happen.

26.04.24 LTCUSDT Short term trade - LONG#LTCUSDT 🟩LONG trade
Enter = $89,28-84,07
Stop = $81,31
TP = $94,11

Long LTCLooking at this chart, it’s clear that there’s a positive sentiment around LTC. The price is hovering nicely above the moving averages, which is a sign that things are on the upswing. The moving averages are neatly stacked, and the price is respecting that pattern, indicating a solid upward trend. The volume is quite heavy as well, suggesting there’s serious interest and support at these levels along with momentum flipping to the upside.

LTCUSDT in consolidation phaseLTCUSDT is showing resistance and support at different levels. Trade is placed considering a breakout at either support or resistance.

Litecoin(LTC): Looking For Rejection From EMAsLitecoin has broken out of the local resistance zone, where the price has somewhat secured this zone as well.
We are not looking at further pushes to EMAs or a local rejection from the current zone (fakeout scenario).
We are waiting for outer zones to be reached, and from there we will be looking for further movement, either to upper zones or to lower zones (breaking that trend as well).
Swallow Team

LTC might hit new Ath During the bull runBINANCE:LTCUSDT
#LTC is in Consolidation face after its halving, and it is huge buy indication for the long term holder, it might fall between the 55$-70$ and it will be best buy opportunity. the shortest target will be 250$ and for long term it will be 600$ or above during the bullrun.
Looking for a team to work with..

LTCUSDT.P will give you a direction from your current positionHello, there! GOOD to SEE YOU.
LTC is retesting now, after breakingout the downtrend line(long-term).
If you see a rebound in the current section and breakout the red resistance line up,
It will rise with huge movement .
Look forward to it!

💎 LITECOIN (LTC) - More Bullish ? What's the Targets ? (READ)By checking the chart of #Litecoin in the weekly time frame, we see that based on the previous analysis, the price has started to grow and we are witnessing a 9% return so far! I still expect more growth from this crypto! ! The targets of this cryptocurrency are $92.5, $115, $200 and $268 respectively!
Please support me with your likes and comments to motivate me to share more analysis with you and share your opinion about the possible trend of this chart with me !
Best Regards , Arman Shaban

LTCIf it gives 78-84 USD, strong buy (spot only or up 3x lev). No TP sports far. If it go up to 120 ted, add more

Litecoin shortLitecoin bounced off the resistance level. Asset broke trough off the ascending trendline. Bearish movement to support level at 80.5 is possible.

Buy Litecointhese are some probable setups for litecoin, at the moment I'm neutral but if there's a backup and test of the backup we can open a long position with low risk.

Buy LitecoinAfter some time of accumulation price is making higher highs, price broke the last high and the backed up to test it again, its a good place to open a long position with low risk.

LTC USDT Long Phemex LTC Current set up. Keep an Eye on this one. I believe that it will be a lead indication on when the next run is about to happen.

H&S Forming on the Daily This is just my 2 cents on the LTC chart, going over the 106 and closing a few daily candles above it for confirmation will invalidate the H&S or if we break and close below 70

💎 LITECOIN (LTC) - New Investment Opportunities ! LONG ? With the new review of the #Litecoin chart after a long time, we see that the price is trading in the demand range of $80 and I expect it to start its strong growth soon from this range! The targets of this cryptocurrency are $92.5, $115, $200 and $268 respectively! The expected yield in the long term is something around 200%!
Please support me with your likes and comments to motivate me to share more analysis with you and share your opinion about the possible trend of this chart with me !
Best Regards , Arman Shaban

LTCThe momentum price has not yet completed its upward trajectory and can reach $95 on the daily timeframe and above $100 in the coming weeks. What do you think? Do you think the recent market drop was a correction or a continuation of the upward trend?


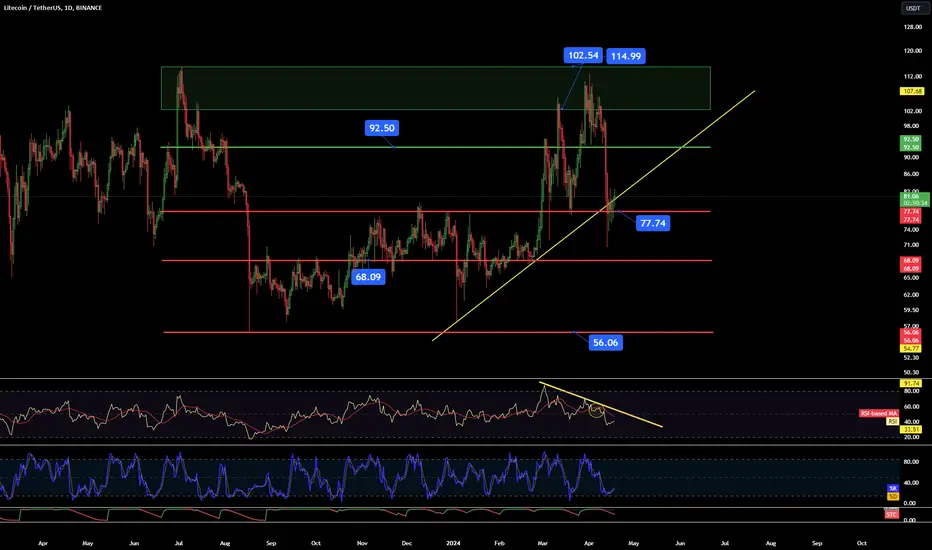
LTC/USDT 1DInterval ChartHello everyone, let's take a look at the LTC to USDT chart on a one-day time frame. As you can see, the price had a dynamic decline and a temporary descent below the upward trend line, but has now returned to the trend line level.
Let's start by determining the support line and as you can see, the price dropped and quickly returned to support around the level of $77.74, then there is an important support level at $68, and then a very strong support level at $56.
Looking the other way, you can see how strong the resistance level is again at $92.5, which may stop the price from rising again to the resistance zone from $102.5 to $115.
Looking at the RSI indicator, we can see how we remain in a downward trend and the confirmation of a return to the downward trend, while the STOCH indicator bounced off the lower end of the range with room to give a greater increase in the current price rebound.