LTCUSDT trade ideas

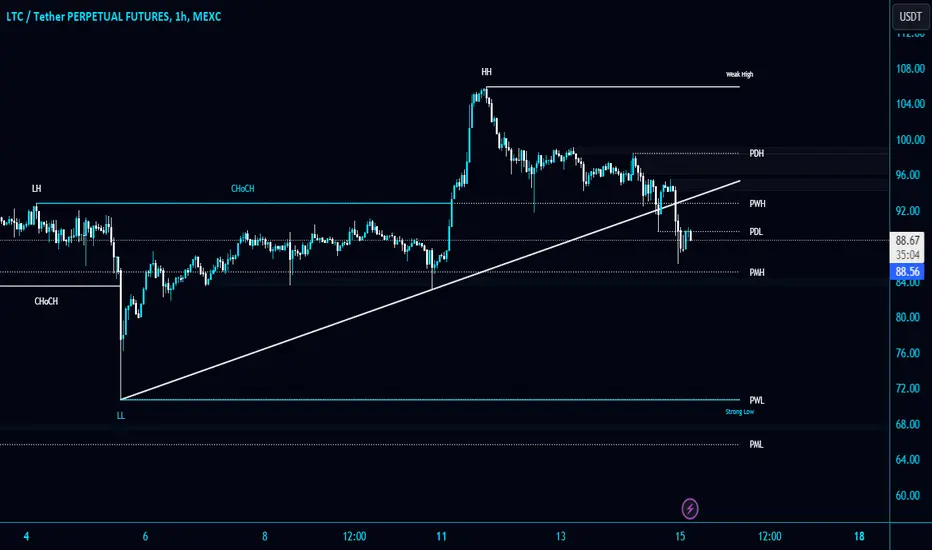
#LTC/USDT breaks the major support level PWH $92.7 and trendline#LTC/USDT breaks the major support level PWH $92.7 and trendline in 1-Hour TF!
CRYPTOCAP:LTC is looking good for a short position. I will wait for a retest to short it. The next local support level is PMH $85.1.
Litecoin looks like a rocket with a delayed launchMost coins and blockchains in 2024 proved their strength after the bearish season. Today, the altseason has arrived for more than 80-85% of crypto assets. Litecoin is next in line for a bullrun.

LTC - BUY SETUP (JAN 2024)LTC - BUY SETUP (JAN 2024)
Using technical analysis, the present configuration of this cryptocurrency indicates an advantageous chance for purchase. Critical indicators point toward promising patterns, hinting at a potentially beneficial entry position. Nevertheless, it's crucial to carefully assess market unpredictability and prioritize risk management before deciding on any investments within the cryptocurrency market.

LTC, the Sleeping Giant now break out!! its ready to takeoff!!Technical Analysis: #LTC (Monthly Update)
#Litecoin now breakout the 238 days accumulation zone, This is just the beginning of new uptrend.
#Litecoin is ready to take off and looks too bullish, it will ready to test its previous high and make new ATH at year-end or earlier.
🥰If you find this helpful and want more FREE forecasts in Tradingview😍.
Please show your support back🙏,
Hit the 👍 LIKE button,
Drop some feedback below in the comment✍️!
❤️🤝 Your Support is very much 🙏 appreciated!❤️🤝
💎 Want me to help you become a better Crypto trader?
Now, It's your turn!
Be sure to leave a comment; let me know how you see this opportunity and forecast.
Trade well, 💪
#LTCCOIN #CRYPTO #BULLISHRUN #ALTCOIN #UPTREND

Litecoin possible ScenarioLitecoin still seems to be in accumulation zone and looking like it want to retrace towards 90-91$ support before going any possibility of going higher.
If bitcoin dumps again ( which I believe will happen ) we can see this as a short term short target for now before tackling the 105$ resistance zone.
I still remain Bullish and I think prices below at current prices is a good long term hold and good entry prices if you believe LTC can hit the ATH again, even if LTC drops further I believe it's just a matter of time before we moon. :)

The last bullish chance of LTCUSDT in Mid term!Hi.
COINEX:LTCUSDT
Today, I want to analyze LTC for you in a Weekly time frame so that we can have a mid-term view of LTC regarding the technical analysis. (Please ✌️respectfully✌️share if you have a different opinion from me or other analysts).
LTC/USDT is about to break out of the symmetrical triangle on weekly timeframe🧐
✅ Due to the Ascending structure of the chart...
- High potential areas are clear in the chart.
- AB=CD
- Ascending Triangle
Stay awesome my friends.
_ _ _ _ _ _ _ _ _ _ _ _ _ _ _ _ _ _ _ _ _ _ _ _ _ _ _ _ _ _ _ _ _
✅Thank you, and for more ideas, hit ❤️Like❤️ and 🌟Follow🌟!
⚠️Things can change...
The markets are always changing and even with all these signals, the market changes tend to be strong and fast!!

Long LTC
LTC prices are still at buyable area because it hasn't made any significant move since 6 months. For long-term investment, I made an analysis, please check the link below.
In short-term, on daily TF, price has just broken the local trendline. I expect that LTC will do something this time after a long consolidation period.
For these reasons, the proposed set-up is as in chart.
Disclaimer:
This analysis is based on my personnal views and is not a financial advice. Risk is under your control.

LTC about to PopMonitor the trend break, Big moves about to happen once this breaks, I think it will hit 130$ area pretty quick once it happens!

#LTC reaching the resistance at 102$#LTC is reaching the resistance of the triangle at $102, if it breaks it can reach the first target around 120/125$.
The daily shows that it is possible, if not, I can see a re-test around $87, where is the first support level.
If you followed me and bought at 64/65$ you should have done a pretty good gain, time to take some of that profit and wait. I'll sell 50% and eep the rest in case it breaks it, buying back at 87$ in case it doesn't this time.
Good luck and stay safe.

$LTC ready to fly#LTC after retesting the break of the resistance now is ready to follow the market too, I expect it to reach the next big resistance around $100, from there it depends what the market does, but if it breaks it it is the beginning of the bullpen, where CRYPTOCAP:LTC can reach ATH.

LTCUSD - ROUND 2The heaviest object in the universe (right after Ripple) looks ready to become a little less heavy.
82% profit target ($190-$200)

Here I buy Litecoin at $95Buying Litecoin at $95
Now the Litecoin moon is set at $95
guys think I need to seek higher returns on low caps. Sorry to say, but I don't need to seek insane returns on low caps. The returns I'll get on these large caps is everything I need here already.
See you up there.

LTC Strategic Move: Collapse down to $56 Buying LiquidityIn light of the Triangle Breakout pattern, Litecoin has successfully reached its upside target. Simultaneously, LTCUSDT has broken above the resistance uptrend trendline, signaling a positive outlook for the long term. However, the current market conditions are presenting a highly intricate timing challenge for both buyers and sellers, with price exhibiting heightened volatility.
Despite the complexity, there's a probable scenario on the horizon. LTC's price might experience a downward move toward the $56 mark, a level often marked by stop losses. Interestingly, this zone is expected to attract significant buying liquidity, serving as a robust support and contributing to a highly favorable LTCUSDT price action.
Stay vigilant for the emergence of a new higher high, as it could indicate a rapid continuation of the uptrend. The key is to remain alert to market dynamics and potential shifts while navigating the current volatility.

NO ONE IS TALKING ABOUT LTC UNTIL THIS HAPPENS - SCENARIO 2
Here is the second scenario compared to the first one this one will be creating a new swing low at $68 before heading up to $140 mid term. If this plays out instead of the first scenario (see below) it is a pretty good risk reward of 6.65.
I will upload the primary degree view for more context stay tuned.
OTHER ANALYSIS

LTC - The FRACTAL that takes us to +300%📉Hi Traders, Investors and Speculators of Charts📈
As I always joke, Litecoin is still in prison... meaning that LTC hasn't been able to break out of long term accumulation yet. This however is A GOOD SIGN for traders because:
👉 Low risk entry
👉 High reward trade
👉 Another chance at accumulation
I'm still watching this fractal and patiently waiting for the first bullish confirmation, as discussed in the video.
_______________________
📢Follow us here on TradingView for daily updates📢
👍Hit like & Follow 👍
CryptoCheck
BINANCE:LTCUSDT

Litecoin ready to move higher?It seems like litecoin is about to break out to the upside!
Watch the trendline carefully, we might see it hits the 100-120 area in the coming days/weeks.

LTCUSD LongLitecoin had consolidation between 68-77 lelevls, 58 was liquidation level for bulls, now it's time to liquidate bears on level 88.

Litecoin(LTC): 100EMA Rejected PriceLitecoin has reached a historically strong EMA from the last time we had pretty sharp rejections in a weekly timeframe.
This time we also had a nice rejection, yet we need to close the weekly candle below this 100EMA, which would possibly mean a movement to lower zones!
Swallow Team

Litecoin (LTCUSDT) Market MomentumLitecoin (LTCUSDT) has been a steady force, treading above the 61.8% Fibonacci support area since late September 2023, creating a stronghold of demand around the $64 level. The recent resurgence sees LTCUSDT reclaiming its position above the long-term uptrend trendline, signaling the potential validation of a mid-term uptrend.
In today's analysis, a compelling chapter unfolds as we witness a potential clean bounce off the short-term uptrend trendline—a support pillar that currently cradles Litecoin's price. Notably, the $69 zone emerges as an attractive buying opportunity, boasting a risk-to-reward trade setup that promises solidity and potential gains.
The journey ahead for LTC holds promise. The $69 zone, with its strategic positioning and enticing risk profile, beckons as a gateway to potential market opportunities. As the gears of Litecoin's market dynamics click into place, our sights are set on the $87 resistance area, where the next chapter of LTC's upward trajectory may unfold.

ltc #LTC #LTCUSDTLITECOIN! LTC formed ascending triangle on ltf ! now if we break it upside we will see 100$ today!!!!!!!!!!!!!!!!!!!!!!!!

LTCUSDT 1D chartLTC/USDT broke dynamic trend line , however still in daily trading range below resistance

$LTC Long tradeCRYPTOCAP:LTC Long trade. According to my fibo levels there should be long trade.
Not a financial advice.
