LTC, the Sleeping Giant now awake!! could it ready to takeoff?Technical Analysis: #LTC (Weekly Update)
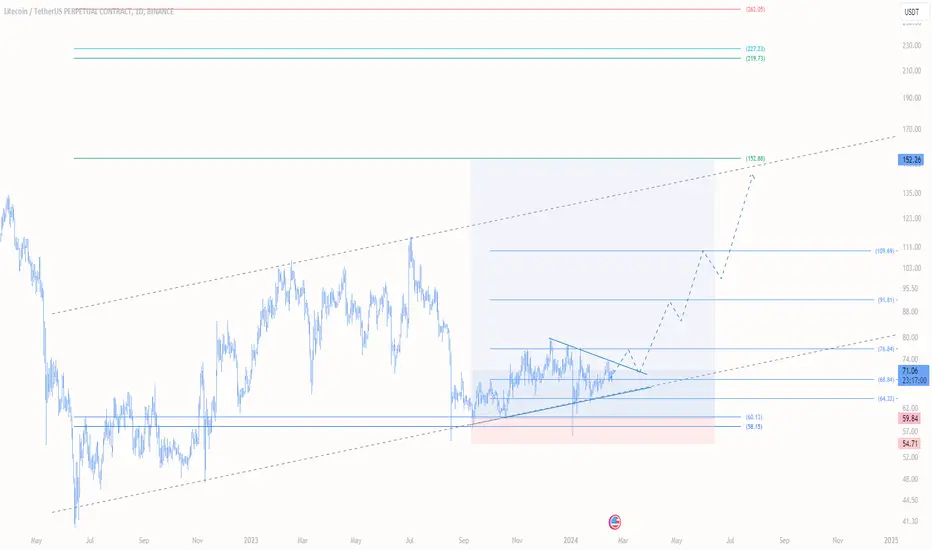
#Litecoin now trying to breakout the 238 days accumulation zone, if it could, this is just the beginning of new uptrend.
#Litecoin is almost ready to takeoff and looks too bullish, if today closing upper the trend line so it will ready to test its previous high and make new ATH at year end or earlier.
🥰If you find this helpful and want more FREE forecasts in Tradingview😍.
Please show your support back🙏,
Hit the 👍 LIKE button,
Drop some feedback below in the comment✍️!
❤️🤝 Your Support is very much 🙏 appreciated!❤️🤝
💎 Want me to help you become a better Crypto trader?
Now, It's your turn!
Be sure to leave a comment; let me know how you see this opportunity and forecast.
Trade well, 💪
#LTCCOIN #CRYPTO #BULLISHRUN #ALTCOIN #UPTREND
LTCUSDT trade ideas


$ltcusdt scalp opportunity hello everyone,
Ltc may go up 5% or so rapidly. it is worth to try.
entry and tp prices at the chart.
ltcFrom the bottom, no penetration to the support level has been done, an upward movement can be imagined

A risky entryLitecoin DES currency is placed in a symmetrical triangle, so the exit from each side allows the possibility of 20% growth or fall for this currency.
There is a possibility of growth for this currency in the time of 4 hours because it is now in an important support range and we can have a long position with good risk and reward as mentioned in this video.
We also identified two other important support ranges for this currency, which we can consider as entry steps for the said signal.
On the other hand, we also determined important resistance ranges for this currency

Litecoin(LTC): Will 200EMA Hold The Price? The 200 EMA and a smaller trend that emerged on a daily timeframe have forced Litecoin into a corner.
Historically, 200EMA has been doing great work, and as long as we see the same results from it, we will see a breakdown in the trend very soon; if not, then 200EMA will turn into the support zone.
Swallow Team

cRYPYYYBREAKTHROUGH??!!!! I see huge upside to this coin, but yeah. what do i know, lets see. cant wait started this year!!!!

LTC/USDT 1HInterval ReviewI invite you to review the LTC pair to USDT chart. In this situation, we will start by defining the downtrend channel using the blue lines.
Going further, looking at the current price decline, we can determine a strong support zone from $67.55 to $66.41, which is also at the lower border of the channel.
Looking the other way, there is resistance at $68.76, then the price rebounded from the resistance at $69.64, and then significant resistance at $71, at the upper limit of the downtrend channel.
On the RSI indicator, you can determine the downward trend line under which it is moving, with dynamic price movements down, while on the STOCH indicator there is still some room for another rebound.

LTC MARK YOUR TREND!Hello Traders and everyone, I am Hadi Karaali, Known as SNIPERS_FX
If you like the idea, do not forget to support with a like and follow.
Here is a quick update on LTC📚
👉As we can see price is still trading inside this falling channel, and price is sitting around our falling channel, where we will be looking for new bearish movement.
👉Meanwhile, as we are looking for trend-following, and for the bears to kick in we need a break below the marked major swing low, as we are in a bullish correction movement.
👉Unless price managed to break above the channel invalidating our opportunity, then a movement higher would be expected. 📚
If you like this kind of analysis don't forget to like and follow
and as usual follow your trading plan and manage your risk.
Be patient and good luck!

BINANCE:LTCUSDT | +500% Profit potential in the bull run On 1W chart LTC is consolidating in the support zone and this consolidation is good for the next trend of the LTC in the bull market.
This is a good place to buy some LTC and hold for the long period and sell it during the upcoming bull run
Allocate only small portion of your overall investment portfolio for this. Preferrably less than 0.5%
Regards,
VectorAlgo

LTC/USDT ascending channel bullish breakout? 🚀Litecoin💎 Yello, Ladies and Gentlemen prepare for a thrilling opportunity with #LTCUSDT, as it's currently navigating through an ascending channel, hinting at a potential bullish leap.
💎 Upon examining #LITECOIN, we've noticed its consistent trajectory within an ascending channel over the past few days. Presently, with its strong upward momentum, should it break above the channel and maintain this thrust, there's a high chance it will aim for the daily resistance level above.
💎 Ready to seize every chance? Stay vigilant for any slip below the channel with $LTC. In such an event, adopting a calm and strategic stance for a bullish rebound from the lower demand zone at $68.84 becomes our play, buoyed by the substantial liquidity present there. And if it dips below that? It’s time to brace for a potential drop and adjust our strategy accordingly.

🔵$LTCUSDT 1D#LITECOIN once again got some SUPPORT from the historical SUPPORT zone around $56 - $61.
Since August 2023 #LITECOIN took multiple SUPPORT and POST 140 days of price action a SYMMETRICAL TRIANGLE formation is seen with multiple new HIGHER LOW formations each time giving enough SUPPORT and possibly pushing the price to break out above the SYMMETRICAL TRIANGLE.
Which may give #LITECOIN traders a LOW RISK & HIGH RETURN entry opportunity.
DYOR (DO YOUR OWN RESEARCH)
Hit 🚀 if you guys like it. Your support means a lot!

LTCUSD: Potential Formation of a Trendline ChannelLTCUSD is hinting at the potential formation of a trendline channel, indicating a structured path that could dictate its price movements going forward. This development suggests a clearer direction for LTC's future price action, offering traders and investors a visual guide to understanding possible support and resistance levels. As LTCUSD carves out this channel, market participants will be watching closely to identify opportunities for strategic entries and exits, based on the channel's trajectory. This pattern emphasizes the importance of monitoring trendlines for those looking to capitalize on LTC's market movements.
LTC Whales favorite Coin will Pump hardLTC broke the long downtrend from ATH , nothing is pending
with BTC dominance getting lower and lower after the ETF approval , LTC will pay Whales attention very soon
DCA from here and Chill

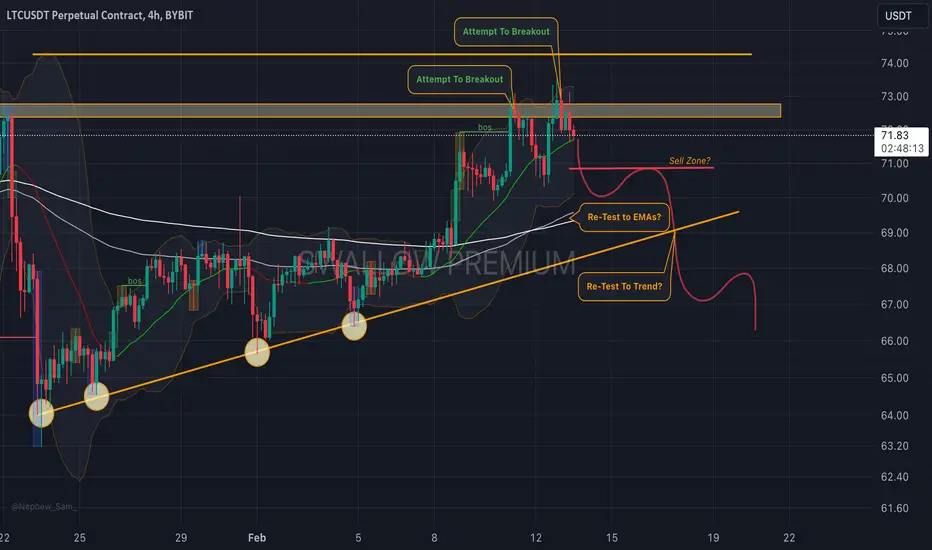
Litecoin(LTC): Failed Breakout Attempt?Litecoin has had several attempts to breakout from that upper resistance zone, but so far it has not succeeded in that.
We are keeping an eye on that branch of EMAs, and also that trend line = chance of seeing a correction to lower zones?
Swallow Team


LTC Its On Bottom from 2021 TOP!Jinny Gann Grid Levels are on the Chart possible Trendlines my WAY. Jinny Gann Grid/Horizontal Lines Works as Support / Resistance. Important levels for the Big Cycle on the chart. Trade Wisely. Coded by Me ;)

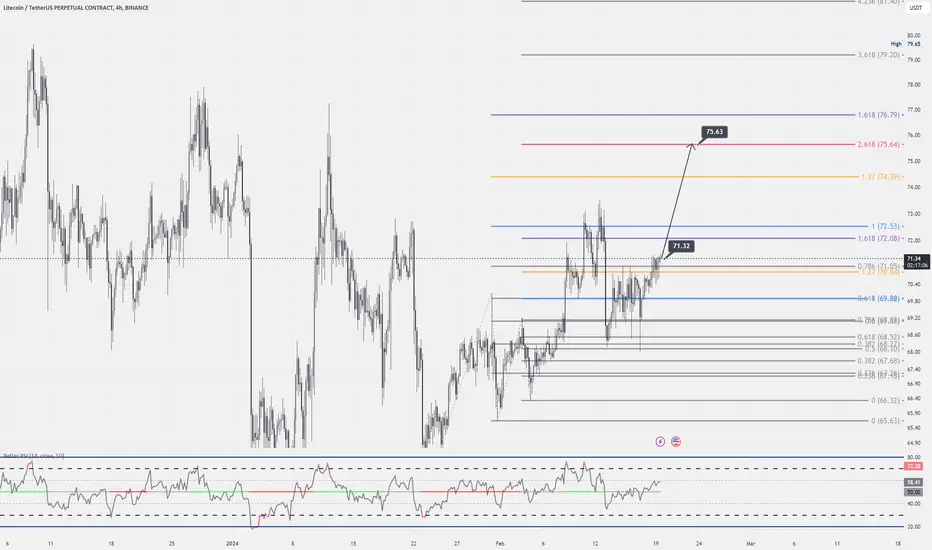
Litecoin symmetrical triangle ideaLitecoin looks to have formed a symmetrical triangle and hopefully breaks out to the upside aiming for the low 90s

Litecoin longLitecoin bounced off the ascending trendline and bounced off the support level. Bullish movement to resistance level at 73.5 is expected to happen.

LTC on a discount LTC is in a good buying zone between 68.5$ to 64.5$. I suggest buying on spot and hodl for the next 2 or 3 months. Its move without a doubt, is going to be huge and gigantic.
DYOR
Not a financial advice.

$LTC Litecoin looks bullishCRYPTOCAP:LTC in my opinion is always the more stable coin out there even after cases of high volatility.
In this scenario it is ready to "touch" the base of the forming triangle, where in my opinion it's a big BUY zone, around 64-65$ to then got up to 99/100$ area.
It will depend then if the volume is high and BTC is behaving as well, but I can see a break out upward and a consolidation around 150$ and then even 400$/500$ in the next bull run (spring/summer in my opinion)

#LTC Two Scenarios ⏳️#LTC Two Scenarios .
Pullback from trendline and resistance zone means Short Scenario.
Breakout of residence plus trendline and retest of trendline means Long Scenario.
