LTC Litecoin Price TargetAfter LTC reached its last price target:
With the stock market reaching record highs, there is growing optimism that the positive momentum could spill over into the crypto market.
Historically, we've seen a correlation between bullish sentiments in traditional markets and increased interest and investment in cryptocurrencies.
As traditional investors seek diversification and alternative assets, the crypto market, with its potential for high returns, could benefit from this wave of enthusiasm.
This alignment with the prevailing positive trends in the stock market might act as a catalyst, fostering a bullish outlook for the crypto market in the coming days.
My Price Target for LTC Litecoin is the next resistance, $75.75.
LTCUSDT trade ideas

"Analyzing Long-Term Support of LTC to Identify Opportunities"COINBASE:LTCUSD is currently trading above a significant long-term support level that has held for 1890 days, as evident from historical price interactions. This support has consistently resulted in a bounce for LTC whenever the price approaches it. While we anticipate another bounce, it is prudent to acknowledge the possibility of a breakdown. Fortunately, the risk associated with this trade is minimal due to a short stop-loss (SL). The trade appears favorable with a low risk and a potentially high reward.
Turning our attention back to the chart, the symmetrical triangle pattern observed indicates similarities with a previous breakout, leading to a substantial 500% increase. The formation of a similar pattern now suggests the potential for another breakout, which could lead to a significant upward movement. Noteworthy resistance levels during this anticipated movement include $79, $135, and the all-time high (ATH).
It is imperative to emphasize that this analysis is not financial advice. Investors are strongly encouraged to conduct their own research (DYOR) and base their decisions on individual risk tolerance and market comprehension.

Litecoin longAscending triangle on litecoin chart is broken up. Bullish movement to resistance level at 75.17 is expected to happen.

Litecoin(LTC): 100EMA Working Well100EMA has been holding the price steady, so as long as we are below this 100EMA and bulls have no control over it, we should see further movement below this line.
We are monetizing this coin and looking for any potential significant rejection to happen, which would lead the price to lower the target zone.
Swallow Team

$LTC #Litecoin Trading IdeaLTC Litecoin the consolidation "king" is inside this consolidation channel on the daily timeframe. It seems that inside the channel it formed a symmetrical triangle next to the mid. range.

LTC - THIS INDICATOR says SELL 🤔📉Hi Traders, Investors and Speculators of Charts📈
Litecoin / LTC is an altcoin that still has massive upside potential for the coming bull season. If you have been following me for a while, you'll know I've been saying we are trading in the opening moments of a new bullish cycle. I've also referred to this as Elliot Wave Theory Wave 1.
According to my plan, this is the first impulse wave towards the upside. But the upwards wave are always followed by correction waves; a natural part of any cycle. I expected the second impulse wave (2-3) only AFTER the BTC halving, which is set to happen in April.
So far, we've seen a correction / pullback across all crypto's. BTC corrected from 48k to 41K and now hovering around FWB:42K where it has found support. But across most altcoins, the bears are controlling the lower timeframes. HOWEVER - this is a great opportunity to get in at lower prices before the second impulse wave starts.
The second impulse wave is know to be the biggest one, with the biggest increase - and that's what we're looking forward to after this correction is over.
For the short term though as pointed out, I'm expecting LTC to trade range or perhaps even slightly lower. This is a great re-accumulation zone, incase you missed the first one.
If you found this content helpful, please remember to hit like and subscribe and never miss a moment in the market s.
_______________________
📢Follow us here on TradingView for daily updates📢
👍Hit like & Follow 👍
CryptoCheck
BINANCE:LTCUSD.P BINANCE:LTCUSDT COINBASE:LTCUSD


#LTC Suppressed PA#LTC
On the weekly we can notice LTC hasnt moved very much similar to the last cycle.
The indicator below is BBW (Bollinger Band Width). When it is low, this means that the bollinger band is tight = volatility is suppressed.
I will go ahead and buy some LTC here for a swing spot, will update in due time.

Price ReactionsThe trend for Litecoin on a weekly timeframe is downward. A descending trendline has been established, and due to the recent lag in growth, the price has revisited the descending trendline area, resulting in a decline. The orange support box at the Fibonacci 0 level is identified as a crucial support area, which has repeatedly influenced price reactions. At present, it is anticipated that the price will fluctuate between the established support box and the descending trendline. A breach in price on either side could significantly impact the overall price direction.

LTC Simetrical Triangle LTC Simetrical Triangle. Bullish
I expecting to breakout of Simetrical Triangle.
After breakout and retest will be looking for Long.

LTCUSDLTC is trying to brake 75-76 several time. now is under resistance and if it brakes (red line) it will be big up. I have big bag of LTC and will add more if it brakes and hold on daily 76.5

Litecoin(LTC): Full Breakdown or Not?LTC has caught our attention here with two possible scenarios.
First one: Wait for breakdown to happen from trend and let bears secure it. From there, we might get a nice opportunity to short this coin!
Second one: Wait for the price to reach upper resistance and see how the market price will react to this zone; potential weakness might be shown there!
Which one are you waiting for the most?
Swallow Team

Scale in buy project Viewing price action in it's raw form based on liquidity and structure interpretation, here's a scale in buy trade projection for lite coin

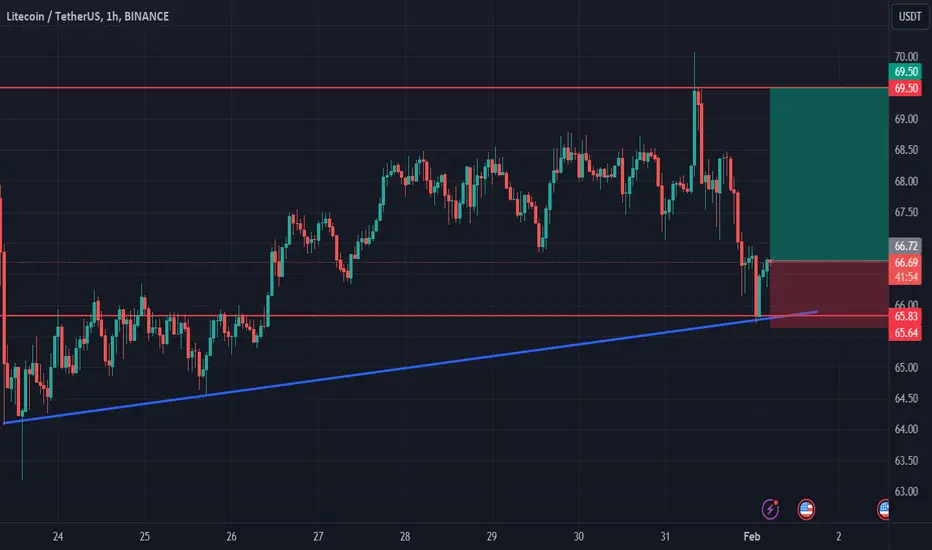
Litecoin longLitecoin bounced off the ascending trendline and bounced off the support level. Bullish movement to resistance level at 69.50 is expected to happen.

LTC: Both scenarios are possibleLTC: Both scenarios are possible
LTC is moving within an Ascending Channel.
So far the price is still bullish and it may continue to rise further as shown on the chart
I am focused more on the bearish move.
If the price moves below the channel I would like to sell LTC.
If the bearish breakout happens it may test $64 again.
If you like the bullish scenario and you are bullish on LTC, simply follow the targets:)
You may find more details on the chart.
Thank you and Good Luck!
❤️PS: Please support with a like or comment if you find this analysis useful for your trading day❤️

LitecoinGood luck to everyone! This analysis is for educational purposes only and does not constitute financial advice. Conduct your own analysis before making trading decisions.

Litecoin(LTC): Potential Breakout Can Happen!!! Time To Buy?LTC coin is showing some strength here with a good potential for upward movement here on a daily timeframe.
We are looking here for a potential breakout with a confident re-test as always, but we are ready for all kinds of movement here, meaning if we fail to breakout, then we might touch that lower line!
Swallow Team

Predictions for Route of LTC.Hello everyone.
All the numbers on the chart : the Entry , Take profit areas and Stop loss are specified.
It seems that the price indicated by the star symbol will be touched before the price indicated by the no entry sign.

LTC Update - 25.01.2024 / Short setup4 hour chart:
I see the coin moving in a full downward oof through withdrawal of internal liquidity, structure breakdowns, FF imbalances and mithigating bts zones.
At this point I'm considering two POIs for a set of shorts positions:
1. Daily FVG that broke local structure to short (Only through confirmation on ltf in the form of nascent off / structure breakdown)
2. Block order zone + ind (Also only through ltf confirmation)
Market maker left enough compression behind the lows to deliver price on the downside, so we just have to wait for rebalancing in POI and trade pattern formation!
Not financial advice, always think with your head! ❗

Litecoin(LTC): Rejected 200 EMAAfter that major rejection from the 200EMA price, LTC has had a hard and sharp rejection without any resistance from buyers.
We are seeing here a further movement to lower zones to occur, but we are prepared for a potential small correction as well before continuing the downward movement.
Swallow Team

LTC inteligentassetyesterday get supported at 63 lower limit
channel
bullish scenario
resistances 70.2 in 50 ema. 72.3 , 76.6, 86.4 W pattern target & 800 ema
bearish scenario
supports 63.7 lower limit channel, 62.47, 57.3, 50.4

Litecoin longLitecoin bounced off the lower boundary of ascending channel. Bullish movement to resistance level at 72.6 is possible.
