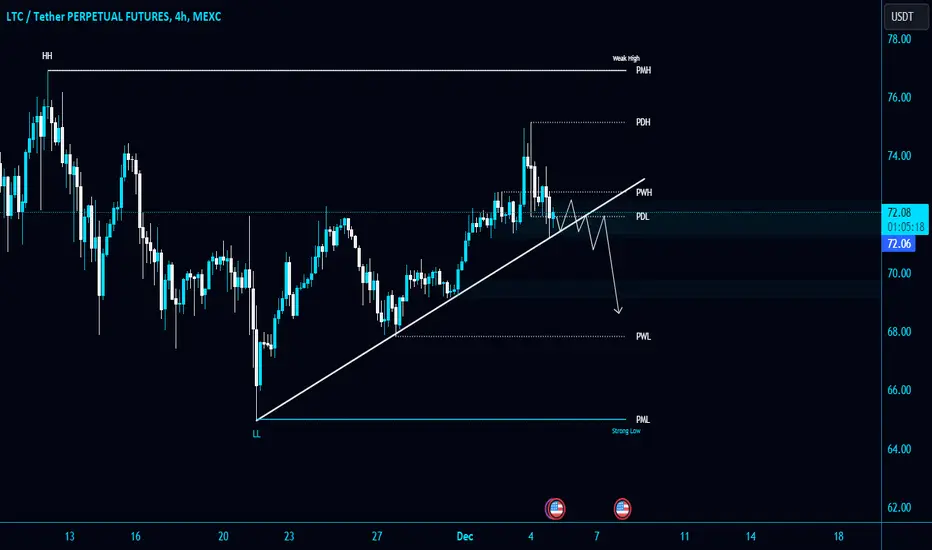
#LTC/USDT is holding the Diagonal Trendline as a support in 4-Ho#LTC/USDT is holding the Diagonal Trendline as a support in 4-Hour TF!
CRYPTOCAP:LTC needs to hold the trendline to gain the bullish momentum. I am expecting a rejection from PWH $72.8 as a resistance. Wait for Trendline breakdown to short it.
LTCUSDT trade ideas
LTC Rally Mode: Your Chance to Buy and Prosper!"Welcome to our crypto exploration hub! We're here to navigate the exciting world of digital assets, providing you with comprehensive insights into market dynamics and potential trading opportunities.Our mission is to decode the crypto market's mysteries and equip you with the knowledge you need to make informed investment choices. From the latest developments in Bitcoin to the hidden potential of various altcoins, we're your trusted source for daily technical analysis.While technical analysis is a valuable tool, it's important to remember that it's just one piece of the puzzle. We encourage you to take a well-rounded approach to your investments, considering factors like macroeconomic trends, news, and community sentiment.Join us for the freshest analyses, and don't hesitate to join the conversation in the comments below. Keep in mind that our content is purely for educational purposes and should not be construed as financial advice. Always integrate it into your broader investment strategy."
LTCUSDT TRBO PLAYLTC Break out at 72.23 Resistance area
Possible new resistance at around 74.37 area
Stop loss below the resistance area
Intraday Set-up
TYOR

Litecoin (LTC): Multiple Selloffs = Potential Downward MovementRecent price movement that has not been able to break above the downward-sloping resistance (upper side of triangle formation) line or fall below the local support area (lower side of triangle formation) shows that markets are getting weaker!
Recent trading sessions have been characterized by multiple sell-offs, suggesting that bears may be gaining strength. However, the lack of a clear break below support keeps the door open for potential reversals. We are looking for a possible break below the support zone around $68.71, which could confirm a bearish movement and initiate a move towards lower support levels, potentially around the $60.50 area.
Conversely, if bulls manage to push the price above the resistance line, it could overturn the bearish scenario and potentially lead to a test of higher resistance levels.

Poised for a Potential RiseLitecoin has established a distinct trading range, delineating clear support and resistance levels. The asset is currently navigating within this range, and has developed a notable demand zone. This zone is pivotal as it may induce a bullish reaction, potentially propelling the price upwards. Presently, LTC is oscillating between these established bounds, and a strategic approach would involve monitoring for a decisive breakout or breakdown from these levels.
Notably, LTC has recently interacted with its support level, suggesting the possibility of an upward trajectory towards its resistance threshold.
This situation warrants a vigilant assessment of price action for potential trading opportunities.
This analysis is for informational purposes only and should not be considered as financial advice.

LTCUSDT scalpingLooks like price moves up and nevel looks back. it's too late for open longs there but there is this nice scalping place under the price. If that hits, let's make some fast and easy win. There is also anotherone below, $69.30 and there we can win even more so if this doesn't work. we get money back then.
🌐💹 Today, we're unleashing the secrets of a killer scalping strategy, where prices pump and profits flow like a river! 💰🌊
🕹️ Scalping Strategy 🕹️
Picture this: quick, precise, and strategic moves in the market. That's scalping for you! 🎯 Scalpers aim to capitalize on small price fluctuations, entering and exiting positions swiftly for rapid-fire gains. It's like the ninja of trading – in and out with lightning speed! ⚡💸
📊 High Liquidity Zones 📊
Now, let's talk about the heart of this strategy – High Liquidity Zones. These are areas on the chart where the order books are stacked, and buyers and sellers are ready to party! 🎉💼 Why? Because high liquidity means there's ample trading volume, making it easier to execute trades without significant price slippage. 📈🌐
🚀 Why Prices Pump in High Liquidity Zones? 🚀
Ever wonder why prices tend to pump in these zones? It's simple economics – more buyers and sellers mean more market activity. When a significant number of orders are waiting to be executed, a surge in trading volume occurs, leading to rapid price movements. It's like a market dance party, and everyone wants to join in! 💃🕺

LITECOIN Litecoin macro view looks like this, its far fetched for the 'two & three' but 'one' path (yellow) is almost certain.

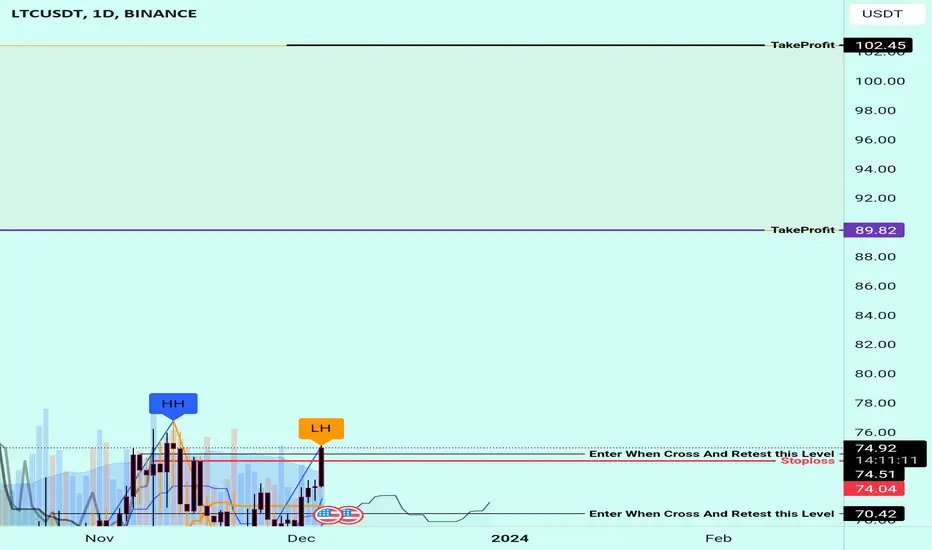
LTC Litecoin Price TargetIf you haven`t bought the dip on LTC:
Then you need to know that Binance, along with its CEO 'CZ,' has confessed to federal charges and committed to settling fines amounting to $4.3 billion.
The crypto exchange “admits it engaged in anti-money laundering, unlicensed money transmitting and sanctions violations"!
The question arises: from where will these substantial funds be derived?
One possible source is Binance's Proof-Of-Reserves, which reportedly exceeds 100%.
Among the tokens impacted is LTC Litecoin.
I've set a short-term price target for LTC Litecoin at $63.40.
Looking forward to read your opinion about it!

LTC currency analysisIs in an attractive ascending trend
But the price of 72 to 76 will be extremely important
Had been suffering in this range for a while
If you could be over 72 a strong candlestick I expect to be the range
77 - 81 - 88 - 94 - 101 - 112
Grow up and see a great pump
But if it fails and the BTC wants to fall, we can at prices
69 - 52 - 49 - 40
Start to make valuable purchases with Targets above 100

LTCUSDT - LONGIn this analysis, we will delve into the technical aspects of LTC/USDT trading, specifically within the context of a rising channel. The focus of our prediction revolves around the anticipation of a breakout beyond the resistance line at $70 USDT. Our strategy involves waiting for this breakout and subsequently identifying a pullback into our predetermined buy zone before executing the trade.
Technical Analysis:
Rising Channel Overview:
The LTC/USDT trading pair has been exhibiting a clear upward trajectory within a well-defined rising channel. This channel is characterized by parallel lines connecting consecutive higher highs and higher lows. The reliability of the channel pattern suggests a systematic and sustained uptrend in the market.
Resistance at $70 USDT:
One of the key elements in our analysis is the resistance line positioned at $70 USDT. This level has proven to be a significant psychological and technical barrier in the recent price action. A decisive break above this resistance is crucial as it may signal a potential acceleration of the upward momentum.
Breakout Confirmation:
Our analysis anticipates a breakout scenario where the price surpasses the $70 USDT resistance. This breakout should ideally be accompanied by a surge in trading volume, reinforcing the validity of the upward move and indicating increased market participation.
Buy Zone Determination:
Following the breakout, our strategy involves patience and precision in identifying a suitable buy zone. This zone is typically located just below the newly breached resistance level. The objective is to wait for a pullback in prices after the breakout, providing a more favorable entry point for the trade.

LTC is ready to push 92 dollar ?Hi everyone, What i see right now is if the LTC should close under 70 dollar today, LTC will countineou to 92 dollar in a short time .

LTC/USDT Bullish Flag Breakout on the Horizon? 👀 🚀Litecoin💎Paradisers, turn your attention to #LTCUSDT, as it showcases a compelling trading pattern. Currently positioned in a demand zone and exhibiting a bull flag formation, there’s a heightened probability for an upward movement.\
💎#Litecoin has demonstrated a consistent pattern of breaking above a descending channel, followed by a retest and then an upward movement. At present, CRYPTOCAP:LTC is indicating a bullish flag breakout. This pattern presents a significant chance for a bullish movement. If the upward trend continues, LTC is set to target the supply level at $76.97, with potential to extend even further to the higher supply zone at $81.65.
💎 For the discerning Paradisers, timing is key in leveraging this opportunity. Identifying the most advantageous entry points during this anticipated rise is crucial, and being mindful of avoiding entry at the peak is advisable. Additionally, for #LTC, be prepared for a potential bullish rebound from the demand zone at $65.30, especially after surpassing the demand at $83.40. However, a decline below this level might indicate potential difficulties in sustaining the bullish trend.
💎 In this dynamic and evolving market landscape, strategic planning and adept decision-making are critical. Developing a comprehensive trading strategy, encompassing effective money management and a thorough understanding of support and resistance levels, is essential for achieving successful trading outcomes. 🌴💰

📈📊 #ChartPattern Alert! 📈📊 📈 Falling Wedge 📈📈 What is a Falling Wedge? The Falling Wedge is a bullish chart pattern characterized by two converging trendlines, with the lower trendline sloping upward more than the upper trendline. It typically signals a potential bullish reversal, with the price likely to break upward after the wedge pattern.
📈 How to Identify:
Draw a trendline connecting at least two higher highs (upper trendline).
Draw another trendline connecting at least two higher lows (lower trendline).
📈 What it Signals: The Falling Wedge suggests a potential bullish reversal, with buyers gaining strength as the price reaches higher lows within the wedge. It often forms during downtrends and can precede a significant price move to the upside.
📈 Trade Strategy:
Consider buying when the price breaks above the upper trendline of the Falling Wedge.
Set profit targets based on the pattern's height added to the breakout point.
Implement a stop-loss to manage risk in case of a false breakout.
Remember to validate your analysis with other technical indicators and conduct thorough research before making any trading decisions. Happy charting and trading! 📈💹

LTC To The Moon Very SoonBINANCE:LTCUSDT
i am bulling now on LTC
this is time for buying
dont waste time in meme coins
buy this and thanks to me

LTC - LITECOIN SWING TRADE IDEAIt is that simple on chart, i think the risk reward is very good there.
Litecoin have been a laggy altcoin but its fundamentals are there and nothing has changed on it.

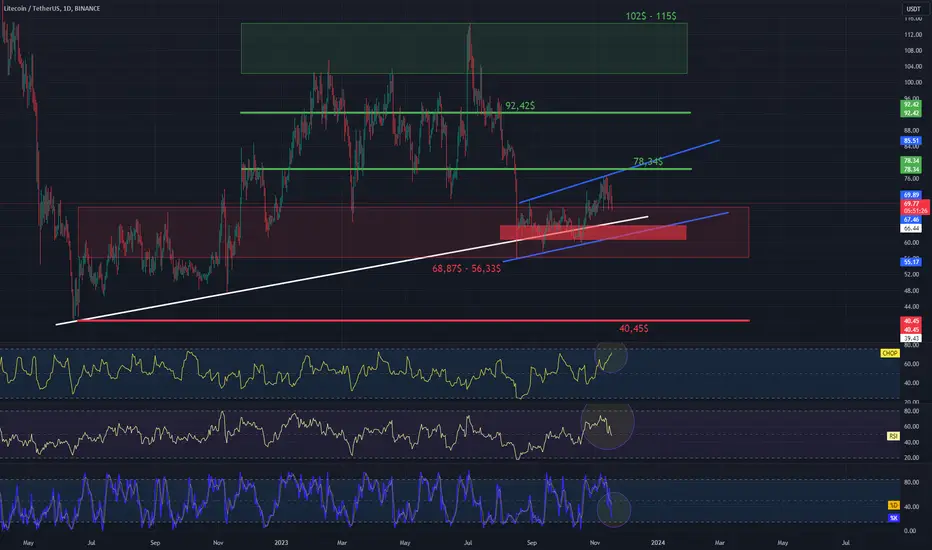
LTC/USDT 1DInterval ChartI invite you to review the chart of LTC in pair with USDT, this time taking into account the one-day time frame. Let's start by defining with the white line the upward trend that holds the price, and then using the blue lines we can mark the local channel of the upward trend in which we are currently located.
When we unfold the FIb Retracement grid, we can see that the price is based on a strong support zone from $68.87 to $56.33, but at this point let's also check for smaller movement and here the zone covering the trend lines and the lower border of the ongoing channel will be important. However, when the price breaks below the current channel and support zone, we may see a drop to the very strong support level of $40.45.
Looking the other way, we can see that the upper border of the channel is also the first place of significant resistance for the price at $78.34, the next important resistance is at $92.42, and then the price must overcome the strong resistance zone from $102 up to $115.
Please look at the CHOP index, which indicates that we have a lot of energy for the upcoming move, the RSI indicator is in the process of recovering, and there is a lot of room for further declines, similarly, the STOCH indicator shows a strong downward movement, which may drag the valuation to a lower level.
🚨 Trade Alert: LTC/USDT (3-5x)🚨 New Trade Alert 🚨
✅ LTC/USDT (3-5x)
📉 LONG Entry Zone: 68 - 72.75
⛔️ SL: 65.41
🔒 Breakeven Move: When it moves close to TP2
🎯 Take Profit:
Short Term: 73.45 - 74 - 76 - 78 - 80
Mid Term: 85 - 90 - 95 - 100 - 105 - 114
📝 Ensure you set entry orders to balance the trade's entry and aim to secure 30% of profits within the first two targets. Once profits are gained, adjust the stop orders to match the entry points or break-even levels.
⚠️ Disclaimer: Historical earnings cannot assure future outcomes. Is there a potential for risk? Certainly. The entire financial market is susceptible to uncertainties; any underlying factor or abrupt shift in market sentiment could overturn the current market trends and lead to losses. Refrain from undertaking undue risks that might jeopardize your financial stability. You are under no obligation to engage in this trade; kindly avoid the trade if you disagree with the trade analysis.
GIS TRADING®

Litecoin (LTC) Would It Continue Its Upward Trend?Litecoin (LTC)
Bitcoin's recent downturn has also influenced Litecoin's price. The asset has repeatedly tested the $66-$68 support zone, five times in the last two weeks, with the price rebounding relatively quickly each time. Litecoin is currently hovering around the resistance zone of $72.1-$73.3.
For LTC, continuing its upward trend remains a priority, but this is contingent on Bitcoin exhibiting a similar pattern. The immediate goal for buyers is to retest the seller's zone at $75.1-$76.9 and attempt to reach a new local high of around $79.
Should the correction persist, it could have a substantial negative impact on Litecoin. The cryptocurrency might decline to the $63.2-$64.8 zone, and if Bitcoin falls to $30,000, LTC could hit a new local low below $60, effectively nullifying its gains over the past month. Thus, short-term investments in LTC currently carry a significant risk.

Litecoin longLitecoin bounced off the lower boundary of ascending channel. Bullish movement to resistance level at 75.77 is possible.

LTC/USDTLITECOIN UPDATE
#Litecoin is a very interesting coin because every halving it has it actually pumps into the halving, so as you can see, when you zoom out we had a huge ascending broadening wedge pattern and then formed a falling wedge pattern and broke down, lots of people got rekt there thinking the falling wedge will pump after the halving, but if you zoomed and and looked at historical data on Litecoin you would have understood that it only pumps pre halving.
So what now?
well we have actually formed a nice 88 day accumulation box and it had broken out of it and now retesting previous resistance as new support, if it holds I have put my 3 take profit targets in green horizontal lines!
my stop loss is the orange line, if we come all the way to the accumulation box again I will add into my spot position, at the end of the day CRYPTOCAP:LTC is silver Bitcoin and will perform well in the bull run and is used in many platforms for payments!


✴️ Easy & Fast 110%-270%-360% Potential 10X Lev. (Litecoin)This chart is looking great. Notice we have a rising channel while Litecoin (LTCUSDT) closed above EMA200 yesterday. Today it is moving ahead.
This is a trade setup that can be taken advantage from.
Depending on your trading style and capital, we have two main stop points: below 72.40 and 70.
We use manual stop-loss.
To the upside, we have three targets, mostly chosen at random, for this short-term trade idea.
1) 11% = 110%
2) 27% = 270%
3) 36% = 360%
More details can be found on the chart.
A older trade idea is present in the 'Related Ideas' section at the bottom.
Disclaimer: Leveraged trading is high risk and for experts only.
Market conditions can change suddenly and liquidation results in all money lost.
This is not financial advice.
Do your own research, trade at your own risk.
Thanks for your support.
I am wishing unlimited wealth... Tons of health and success, joy and happiness.
Namaste.

LTC looks promising!In this pitchfork you can see the main levels.
Looks very promising as of now. I think it goes to around 140 to the main level as shown in the graph. I myself have bought a good amount of LTC here. Let's see how this goes.
