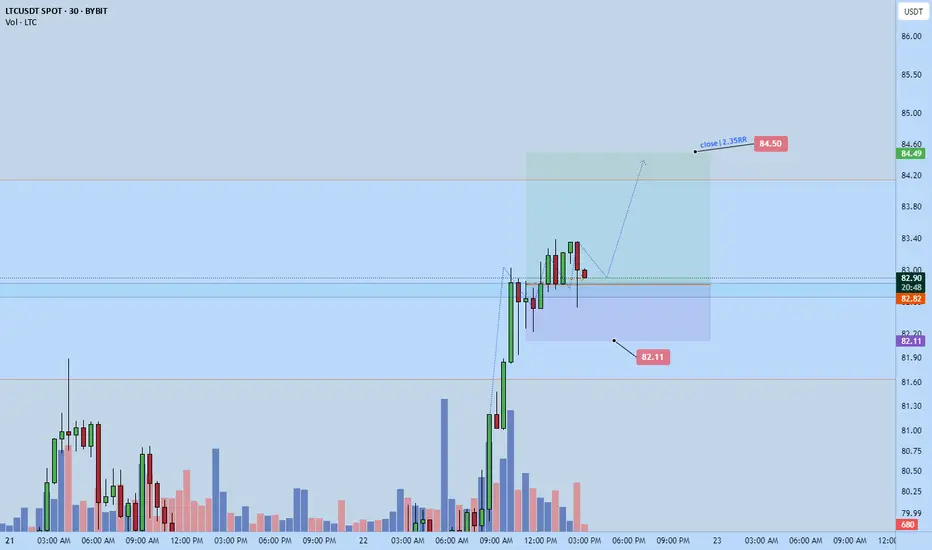
Litecoin scalp longJust now hopped into this litecoin scalp long. Targetting $84.5
Expecting to tp within next 4hrs or less....maybe like 2hrs.
DTT applied but a little bit more risky hence why want to get in and out quickly.
Overall market is trending up, this an attempt to take advantage of the momentum
LTCUSDT trade ideas

LTC long to $75.65 today!Just now opened a long position on ltc. Expecting a break to the upside before further selling if its that the market want lower prices.


Litecoin Breakout and Potential RetraceBINANCE:LTCUSDT : Hey Traders,
In today's session, we're keeping a close eye on LTC/USDT as it approaches the $77 area, a key support-turned-resistance zone.
Litecoin recently broke below its previous uptrend, indicating a potential shift in momentum. It is now in a corrective phase, with price retracing back toward the broken trendline and horizontal resistance around $77.
This level could act as a strong rejection zone, offering a potential selling opportunity if bearish confirmation shows up.

LTC/USDT:BUYHello friends
Due to the good price growth, we see that the price has hit a lower ceiling and has fallen, which we can buy in stages during the price decline, within the specified ranges and move with it to the specified targets.
Observe capital and risk management.
*Trade safely with us*

Litecoin (LTC): Getting Ready For Another 30% Drop?Litecoin is forming a smaller bullish trend here, where usually after the correction if we see these kinds of moves we are experiencing a further dip, so let's see if we manage to form a breakdown!
More in-depth info is in the video—enjoy!
Swallow Team

Litecoin (LTC): Forming Bullish Channel, Might Shoot UpLitecoin is forming here a nice bullish channel from where we might see a quick spike to upper zones.
Our first target zone is that bullish CME gap, which we intend to see filled, and once we see further dominance, then the upper resistance zone (where there are a lot of FVGs).
Swallow Team

LTC/USDTLTC ETF might be approved, LTC pushed off the trend line. Hashrate is at its highest levels, whale wallets are increasing their coin holdings. Now is a good price to add the coin to portfolio.

Litecoin (LTC): Possible 22% Recovery IncomingLitecoin has a chance to recover 22% from current zones as we have one unfilled CME gap and we are in overbought zones with Bollinger Bands. Waiting for confirmations now but it seems we will fill the CME soon!
More in-depth info is in the video—enjoy!
Swallow Team

Litecoin (LTC): Possible Recovery of 30%Litecoin has recently done another liquidation movement where usually we have had a similar move of recovery.
That's what we are looking for: a recovery to upper zones where the first target is going to be the EMAs and the second one would be the upper resistance zone (the region around it).
Swallow Team

Short-Term Short Position LTC/USDT🔥 LTC/USDT – Approaching Key Short Zone
Litecoin (LTC) has formed a rising wedge structure after rebounding sharply from local lows. Price now faces a critical short zone near 81.62 - 84.16, where sellers could potentially step in if LTC fails to break above with conviction.
🟣 Zone to Watch
“Possible Short Zone” (in purple) — a high-probability entry area for short trades given the overhead resistance and wedge convergence.
Entry Points:
Entry 1: ~81.62 (initial level within the wedge)
Entry 2: ~84.16 (upper boundary, near resistance)
📉 Momentum & Setup
Chart Formation: The rising wedge implies potential exhaustion of bullish momentum if price fails to continue upward. A break below wedge support often signals a bearish turn.
Volume Consideration: Look for a sell-volume uptick or a clear rejection around Entry 1 or 2 or within the short zone to confirm a likely reversal.
🟢 Take-Profit Zones
✅ TP1: ~79.25
✅ TP2: ~75.08
✅ TP3: ~69.55
✅ TP4: ~63.53 (Extended downside if momentum persists.)
❌ Invalidation Level: 87.30+
(A strong close above this level indicates a breakout from the short window)
🧠 Narrative
This setup showcases a potential bearish retest, as LTC’s swift rebound has led price into a narrowing wedge. If buyers fail to push beyond 81.62 – 84.16
Savvy traders may anticipate a correction. A volume-backed rejection in this zone could send LTC back toward its lower support levels.
🎲 Market Context
Monitor broader market sentiment and Bitcoin’s performance; a strong BTC rally could invalidate downside expectations.
📌 Risk Management
Position Sizing: Trade responsibly according to your risk tolerance.
❌ Stop-Loss: Place it above the invalidation level (e.g., around 87.30+ to mitigate unforeseen breakouts.
Reevaluate if the market shows signs of bullish continuation beyond the wedge.

Litecoin analysis using multiple toolsPlease read the full analysis to get the complete picture.
Let's start with the trend lines.
We have three increasing angles of support trend lines. The third one marked with this week's low so it might change if we happen to get a lower low.
For the resistance we have R1 which is anchored at the ATH at the December 2024 top. This resistance trend line was tapped twice more, in January and February 2025, creating marginally lower highs marking the triple top which sent Litecoin to its recent low.
R1 and any of the support trend lines, most notably S2 create a symmetrical triangle. This triangle can break either way and any time. So in theory, it could take it's time until late 2026 or early 2027. If it breaks in 2026, I would expect it to breakdown given that would correspond to the bear market timing of the bitcoin four year cycle.
Next let's take a look at the pitchfork.
This is a Schiff pitchfork from the 2018 bear market lows to the all time highs to the 2022 bear market lows. Macro pitchforks like this one tend to be respected. We can see that the August 2024 low hit the outside line of the pitchfork. The 0.5 line (green) flipped multiple times in this cycle between being support and resistance.
The Schiff pitchfork in this case gives us the most conservative targets. More bullish targets are observed when switching to the modified Schiff pitchfork. However, for proper risk management it is better to start with the Schiff pitchfork and only if the price breaks the resistance levels, then switch to the modified Schiff. Here is the modified Schiff pitchfork:
We can see interesting price interaction here as well. The August 5th 2024 weekly close was still above the outside line. The currently weekly low also hit the outside line. Similarly to the Schiff pitchfork, the 0.5 line also flipped multiple times being support and resistance.
Zooming in on the price action since the December 2024 high, we can examine the Fibonacci retracement and how it aligns with the pitchfork, supply zones and a fair value gap (FVG).
At the time of this writing, we are about 5 hours away from a pretty bullish weekly candle about to close above the 0.236 Fib with the first significant volume increase since the week of February 24th. The next Fib levels are potential resistance levels. The 0.382 and 0.5 Fibs fall within the first supply zone. The 0.786 and the final 0.886 Fibs fall within the second supply zone. The most bullish artifact on the chart is the weekly FVG. These gaps tend to be filled and the one we have here borders the 0.618 Fib. Moreover, the pitchfork 0.5 line falls withing this FVG. If the FVG will be completely filled during a rally in the next few months, the price will break above the pitchfork 0.5 line and hit the resistance at 0.618 Fib.
If the price breaks the 0.618 Fib the next resistance area will be composed of the second supply zone, 0.786 and 0.886 Fibs and R1. Once this resistance area is cleared and price breaks above the December 2024 high at 147$ it can challenge the Schiff pitchfork median line with price targets at 180-190$ depending on when it will be hit. The median line is expected to be a major resistance, especially since it will be the first touch hitting it. If broken, the modified Schiff pitchfork gives targets at 230-250$ depending on when it will be hit.
For completeness, a quick look at the RSI and SRSI.
RSI is around 43. SRSI is about to cross bullish ( [ending the weekly close) and still needs both the fast line and slow line to cross 20 for a complete bullish signal.
No altcoin analysis is complete without examining the BTC pair.
LTCBTC had last week the lowest weekly close since the week of November 4th 2024. In the RSI this resulted in the first instance of a bullish divergence since the LTC significantly outperformed BTC in November 2024. A similar bullish divergence happened leading into the week of November 4th 2024. However, note that since January 2024 LTCBTC made lower lows while most of the time the RSI made higher lows. Therefore, we can observe a continued period of weekly bullish divergences since January 2024 but it only unfolded into significant outperformance in November 2024. So, the bullish divergence is clearly bullish but it is hard to tell if it will result in LTC outperforming BTC in the near or far future.
The SRSI is oversold but I wouldn't build too much on that.
Also, not shown, LTCBTC MACD and LMACD are clearly crossed bearish.
To sum up, LTC seems to have a clear path to the upside if the BTC bull run continues. As for whether or it will outperform BTC, it is hard to tell.

LTc pump to $80.71 today.I just opened a long position on ltc. Anticipating a pump all the way up to $80.70 and possibly a bit higher but I'll be closing position there.

LiteCoin (LTC) - Chart reading with Weis Wave with Speed Index
Lesson 15 Methodology:
1. Largest up volume wave at the bottom after while (probable buyers but let's confirm using AVWAP and Weis Wave with Speed Index and it's Plutus Signals.
2. Placed AVWAP at the beginning of the previous down wave and wait for price to pullback to it.
3. Price Respects AVWAP.
4. Abnormal Speed Index 40.8 is a sign that price has a hard time to move down.
5. Enter Long on PL signal.
... and up we go!!!!
Target Fib area which was reached!
No entries now - Fib could risky!

LTC/USDT 1W ChartHello everyone, I invite you to review the current situation on LTC. When we enter the one-week interval, we can see how the price is struggling to return above the upward trend lines.
Here you can see how the current rebound is going towards resistance at $ 82.82, then resistance is visible at $ 95, but an important resistance point will be around $ 115.
Looking the other way, you can see that the price has gone below the support level at $ 70, however, we could see a quick rebound, in a situation where the price continues to go down, the next very strong support is around $ 50.
It is worth looking at the RSI indicator, which shows another descent in the week interval to the level where we could previously see strong price rebounds, which could potentially repeat itself.

Updated LTCLTC was unable to maintain its support zone and has now reached lower price levels and it continues.


LTCLTC short. As you can see, I will be shorting LTC on the 1h breaker block equalibrium. General bias is bearish. I am watching for the 4h OB reaction if it pushes through or not, and hence will change the setup.
Goodluck.

Litecoin: Your Altcoin ChoiceAn ultra long-term accumulation zone has been activated. Litecoin has been producing higher lows since 2018.
Right now we are looking at a major, major buy opportunity. Likely the lowest price before the start of the 2025 bull-market.
Litecoin just activated its 2022-2024 buy-accumulation-support zone. A very long, wide and strong zone.
I don't think there is much to say about Litecoin other than the time is right and the time is ripe. Growth can only happen after the completion of a bearish wave. A bearish wave is exactly what is seen on the chart now between December '24 and present day, with the bottom being hit just two days ago on April 7. This is no "bear market" as Litecoin has been sideways long-term as it can be seen clearly on this chart.
Long-term consolidation can only happen for so long. Litecoin bottomed in June 2022, almost three years and a half ago. This is the longest accumulation phase ever, and this in-turn will produce a bull market that is equally strong.
A new All-Time High is definitely on the cards for this year. This is true for Litecoin as it is true for Bitcoin, Ethereum, Cardano and most of the Altcoins market.
It is still early though and I know it is easy to doubt, and this is ok. But this long-term view of the chart leaves no room for doubt, the market has been rising from its base. Long-term higher lows, since December 2018, a signal of strength. The last bullish jump was the "initial bullish breakout," it tends to happen before the bull market phase.
The bull market is the cycle when everything grows.
A bull market tends to end in a bull-run.
A bull-run means euphoria across the market. Maximum bullish momentum accompanied with maximum growth.
We are getting so close now. We are looking good and we are looking up.
My recommendation stays, buy and hold.
Go all-in 100% Crypto.
Plan ahead if you decide to trade anything other than spot.
Spot is an easy buy and hold focusing on the long-term.
Leverage (margin) can be more complex and everything can be lost with a mistake. If you have any doubts, do not use this system for now. Only use it with profits or money to spare.
Right now is the time to secure very good and strong entry prices before the best since 2021. It will be amazing.
Thank you for reading.
Litecoin, a great Altcoin Choice!
Namaste.

LTC 1W Support Level ..Bullish Case (If Trendline Holds):
• Possible upside targets:
• Resistance at $100
• Medium-term: $160
• Long-term potential: $280+, if the crypto market enters a strong bullish phase.
⸻
Bearish Case (If Trendline Breaks):
• If it breaks below this trendline with volume, downside risk could open to:
• $36
• $22
• or even retest the lows around $13, depending on market sentiment.
⸻
Long-Term Spot Strategy:
• High-probability entry zone for long-term holders.
• Dollar-cost averaging (DCA) around this zone can be a solid plan.
• Stop-loss placement (for risk-managed traders) can be considered slightly below the trendline, e.g., $60 or $50, depending on your risk tolerance.

LTCUSDT 1WLTC ~ 1W Analysis
#LTC Buy gradually when re -testing this support with a short -term target of at least 15%+.
