Litecoin Approaching Resistance: 20% Drop to $70 Support ExpecteHello and greetings to all the crypto enthusiasts, ✌
Let’s dive into a full analysis of the upcoming price potential for Litecoin 🔍📈.
Litecoin is situated within a parallel channel and is nearing an important trendline and resistance zone. Given the current market conditions, I foresee a potential correction of approximately 20%, with a key support level at $70. This price point not only holds psychological significance but also acts as a crucial technical support area.📚🙌
🧨 Our team's main opinion is: 🧨
Litecoin is near a key trendline and resistance, and I expect a 20% drop to $70, a strong support level with psychological significance.📚🎇
Give me some energy !!
✨We invest hours crafting valuable ideas, and your support means everything—feel free to ask questions in the comments! 😊💬
Cheers, Mad Whale. 🐋
LTCUSDT trade ideas

LTC Targets $70: A High-Probability Reversal SetupLitecoin (LTC) has just broken below the critical $80 low, signaling that bearish pressure is firmly in control. Currently trading at $79—just beneath the swing low at $80—LTC is also sitting below the monthly open at $82.98. With the bears flexing their dominance, traders are left wondering: Where does the price head next? What’s the target for the bears, and where can bulls find an opportunity to re-enter the market? Let’s dive into the charts, pinpoint the key levels, and craft a plan that could turn this downturn into a golden opportunity.
The Current Market Picture
LTC’s recent breach of $80 confirms the bearish momentum that’s been brewing since its peak at $147.06 on December 5, 2024. Litecoin enjoyed a stellar 122-day bullish run, soaring +195% from $49.80 to high at $147.06. Now, we’re on the 122nd day of a downtrend—a poetic symmetry that hints at a potential turning point. The question is: where will this descent find its floor, and how can we position ourselves for what’s next?
Support Zone: The $70 Fortress
To identify a robust support zone, we need confluence—multiple technical factors aligning to form a level that’s tough to crack. Here’s what the chart reveals:
Fibonacci Retracement: Using the Fib tool from the 2024 low at $49.80 to the high at $147.06, the 0.618 retracement at $86.95 has already been lost, turning our focus to the 0.786 level at $70.61. This deep retracement is a classic spot for reversals, making it a prime candidate for a support zone.
Yearly Level: At $70.14, this pivot is nearly identical to the 0.786 Fib level, adding significant weight to the area.
Volume Profile: The Point of Control (POC) from a 1.5-year trading range sits right around $70, just above the Fib level. This is the price with the highest traded volume over that period—a natural magnet for price action.
Yearly Order Block: Visualized as a green channel, this order block reinforces the $70 zone, suggesting past institutional buying interest or significant support.
Together, these factors create a $70 support zone that’s brimming with confluence. It’s not just a random level—it’s a fortress where bulls could mount a serious stand.
Long Trade Setup:
Entry Strategy: Use a Dollar-Cost Averaging (DCA) approach to build your position. Start with small buys around $75, laddering down to $70, and increase your position size as price nears the core of the support zone. Aim for an average entry of $73/72.
Stop Loss (SL): Set it below $68 to protect against a deeper breakdown while giving the trade room to breathe.
Take Profit (TP): First Target: $80 (the swing low and monthly open not far off). Main Target: $100 (a key psychological and resistance zone).
Risk-to-Reward (R:R): With an average entry at $73 and SL at $68, you’re risking $5 to gain $27 (to $100)—a stellar 5:1 R:R or better. This is a high-probability setup that rewards patience.
Execution Tip: Watch for bullish signals in the $70-$75 range—candlestick pattern, volume spikes, or RSI divergence. This isn’t about chasing; it’s about precision.
Resistance Zone: The $100 Battleground
If bulls reclaim control and push LTC higher, the $100 psychological level looms as a major resistance zone. Here’s why it’s a HOTSPOT:
Yearly Open: At $103.28, this level is close enough to $100 to bolster its significance.
Anchored VWAP: Drawn from the 2024 low at $49.80, the VWAP currently sits around $102.4, adding another layer of resistance.
Historical Context: The $100 mark has been a recurring battleground, with bulls and bears clashing repeatedly. It’s a price that carries weight.
A rally to $100 wouldn’t just be a recovery—it’d be a statement. A clean break above could hint at a broader trend reversal, but until then, it’s a ceiling to respect.
What’s Next? Bears vs. Bulls
For now, the bears are driving LTC lower, with the break below $80 opening the door to the $70 support zone. That’s their likely target—a level where selling pressure could exhaust itself. For bulls, $70 isn’t just a floor; it’s a launchpad. The DCA long setup offers a low-risk, high-reward entry.
Wrapping It Up
Litecoin’s drop from $147.06 to $79 has been brutal, but the chart is screaming opportunity. The $70 zone—backed by Fibonacci, levels, volume, and order blocks—is where bulls could turn the tide. With a DCA entry at around $73/72, SL below $68, and a main target at $100, you’ve got a trade setup that could deliver a 5:1 payoff. Meanwhile, $100 stands as the bears’ next big test if momentum shifts.
So, will you wait for LTC to hit $70 and strike, or watch the action unfold? The levels are clear—now it’s your move. Use this analysis to sharpen your edge, and let’s see where Litecoin takes us in the days, weeks, and months ahead.
________________________________________
If you found this helpful, leave a like and comment below! Got requests for the next technical analysis? Let me know, I’m here to break down the charts you want to see.
Happy trading =)

Litecoin 52RLitecoin is potentially just about to enter into a major support zone.
There is a larger degree white pattern forming an ABC correction wave and a smaller degree purple wedge pattern currently heading into the support zone.
This convergence makes this potentially a great opportunity if it moves into the zone as shown.
Trade rating 8.5/10
Probability 7/10
Risk to reward 10/10

LTC ANALYSIS (support & resistance)🔮 #LTC Analysis 🚀🚀
💲💲 #LTC is trading between support and resistance area. There is a potential rejection again from its resistance zone and pullback from its major support area. If #LTC sustains above major support area then we will a bullish move till its major resistance area
💸Current Price -- $82.20
⁉️ What to do?
- We have marked crucial levels in the chart . We can trade according to the chart and make some profits. 🚀💸
#LTC #Cryptocurrency #DYOR

Litecoin scalp long to $84.5Just now open a scalp long position on litecoin. I anticipate that the market will spike up soon towards $84.5 area before pushing back down.

LONG Position LTC/USDT#Singal
LTC/USDT
🟢 LONG Position
🎲 Entry1 @ 76.19
🎲 Entry2 @ 74.62
✅ Target1@ 79.35
✅ Target2 @ 84.66
✅ Target3 @ 91.46
✅ Target4 @ 104.39
❌ Stop Loss @ 69.56
Leverage: 5X_15X
Margin: 10% of Wallet Balance
⚠️"Take Care of Risk Management for Your Account"


LTC - Perfect Signal/TA Was Given Days AgoLook at those Levels.
I post both previous signal too, so you you can track it and see how those Levels and Lines played out nicely :).
I wrote : "Lower points like VAL and last low are local key levels. If the price loses these levels, then a it goes lower."
We got several beautiful Short, even a small long.
💲💵 7.6 %
💲💵 6.6 %
💲💵 5.9 %
💲💵 2.5 %
and even more ... 👌 🎯
TA given on 16th March:https://www.tradingview.com/chart/LTCUSDT/Uuxk9kRM-LTC-Some-POIs-Better-to-Short/
Follow for more ideas/Signals. 💲
Look at my other ideas 😉
Just donate some of your profit to Animal rights and rescue or other charity :)✌️

50% GAIN LTC - Range playMost people buy high and sell low. However, in this range we have the opportunity to do the opposite. Buy around this area and sell in the above area.

MAJOR BEARFLAG ON LITECOIN - Thing are not looking goodAfter this nice upthrust from bitcoin we have to admit that we are still in a bearmarket. Even though Bitcoin looks to get support, altcoins still look bad. Uncertainty is still present in the markets, and things are far from over in the world of politics. That's why I still trade this trend, until the end. Meaning, when the trend changes so do my swingtrades. To be clear: This is a swing trade, target unknown. Can be trailed with a stoploss.

Litecoin can be bought a little laterStill, I'm waiting for the crypto market as a whole to fall once again. Prices 80-90 are great for buying. I expect a correction in the coming weeks for this coin.
It is important to remember that investing in cryptocurrencies involves financial risks, it is recommended to consult a specialist before making a decision.

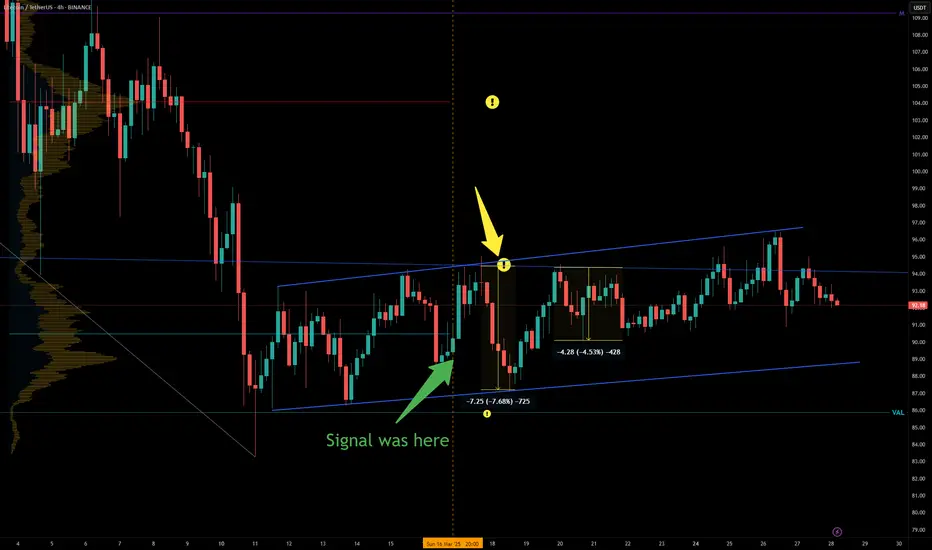
LTC - What a Nice SIGNAL was given days ago.That marked level (yellow point) gave us 2 beautiful easy Shorts.
7.6 % 👌 🎯
4.5 % 👌 🎯
Original TA was here:https://www.tradingview.com/chart/LTCUSDT/Uuxk9kRM-LTC-Some-POIs-Better-to-Short/
Follow for more ideas/Signals. 💲
Look at my other ideas 😉
Just donate some of your profit to Animal rights and rescue or other charity :)✌️
Thread 1: LTC - Spot Signal 2025Hello there,
Today, I’m kicking off 50 dedicated threads to track key parameters and critical trading pairs. Specifically, these will cover Total, Total 2, Total 3, BTC.D, BTC, the top 50 coin list, and select standout tokens.
I’ll focus on one thread at a time, delivering major updates within those threads instead of scattering small posts for every change. Feel free to hit Follow and keep tabs on the threads that catch your eye!
Thread 1: LTC - Spot Signal 2025
Buy Zone: $85 - $95
Targets: $180 - $200
Hold Time: Throughout 2025
Updates: I’ll drop additional updates here when LTC shows significant shifts.
Good luck out there!

casually sniping the bottom in LTCUSDTI stumbled upon my old Elliott wave labels on the LTCUSDT , checked it's short term relative strength with BTCUSDT , looked more closer to the weird sideways to up consolidation and found a dodgy long with a microscopic stoploss , targeting ATH like a degen ...

LtcThe two arrows marked on the chart are the appropriate areas for entering a short trade. Entry with candlestick confirmation

Litecoin $LTC to 109$?⚠️ RISK TRADE ⚠️
👑 #LTC/USDT BUY 👑
Entry price:
91 🟩
Targets:
1️⃣ 97🎯
2️⃣100🎯
3️⃣106🎯
4️⃣109🎯

LTC - Perfect Signal Gave 8 %What a beautiful short Signal. To the damn point!
👌 🎯 8 %
Original TA was give here:https://www.tradingview.com/chart/LTCUSDT/Uuxk9kRM-LTC-Some-POIs-Better-to-Short/
Follow for more ideas/Signals. 💲
Look at my other ideas 😉
Just donate some of your profit to Animal rights and rescue or other charity :)✌️

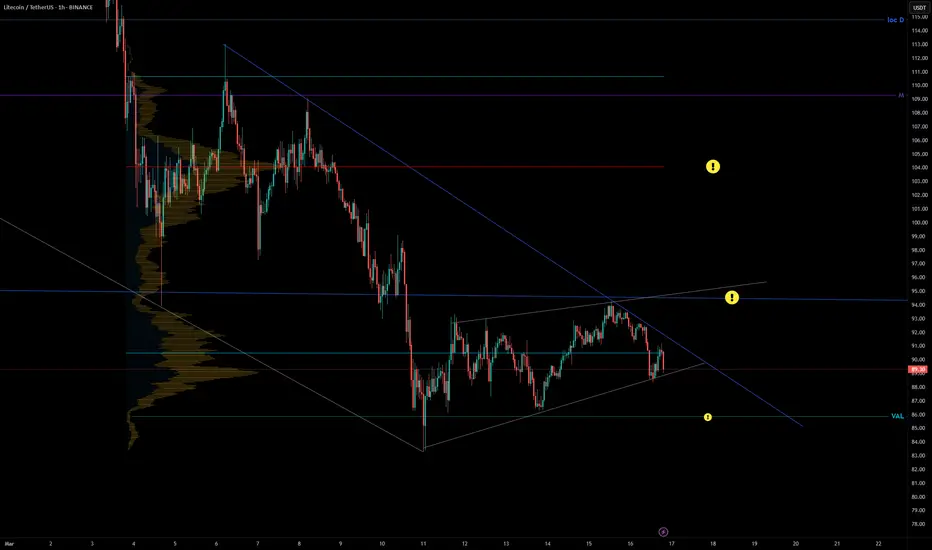
LTC - Some POIs - Better to ShortThere are some POIs for shorting.
Both upper yellow marks seem to be a good level.
BUT: We must do a new TA (volume etc...) if the price reaches there !
Lower points like VAL and last low are local key levels. If the price loses these levels, then a it goes lower.
You can even trade the grey TL (rising channel)
Follow for more ideas/Signals. 💲
Look at my other ideas 😉
Just donate some of your profit to Animal rights and rescue or other charity :)✌️
LTCUSDT Breakout Loading….BINANCE:LTCUSDT has been consolidating for several days, repeatedly testing resistance levels. This pattern suggests a potential breakout is on the horizon. With ETH already gaining momentum, Litecoin could follow suit. Once the market starts moving, plenty of trading opportunities may arise.
Trade Smart: Always use a stop loss and manage your risk effectively.
BINANCE:LTCUSDT Currently trading at $91.5
Buy level: Above $91
Stop loss: Below $83
Target : $130
Max Leverage 3x
Always keep Stop loss
Follow Our Tradingview Account for More Technical Analysis Updates, | Like, Share and Comment Your thoughts

BUY LTC at $90? | BTC | XRP | DOGELTC sitting on major trendline at $88
Holding here will be a long term buy.
I will accumulate here and will sit tight after so much turbulance on this coin.

LTC Long SetupWould like to see a liquidity grab at $89.60 before moving to fill the gap.
Entry: 89.60
TP: 94.31 | 95.34 | 96,49

LTC Ready for PUMP or what ?The price can encounter a strong pump after declining to the bottom of the triangle, and after breaking the triangle, it can reach the desired targets.
Give me some energy !!
✨We spend hours finding potential opportunities and writing useful ideas, we would be happy if you support us.
Best regards CobraVanguard.💚
_ _ _ _ __ _ _ _ _ _ _ _ _ _ _ _ _ _ _ _ _ _ _ _ _ _ _ _ _ _ _ _
✅Thank you, and for more ideas, hit ❤️Like❤️ and 🌟Follow🌟!
⚠️Things can change...
The markets are always changing and even with all these signals, the market changes tend to be strong and fast!!

LTC/USDT 1W🩸 CRYPTOCAP:LTC ⁀➷
#Litecoin. Macro chart Another
💯 Intermediate Target - $194
🚩 Macro Target 1 - $270
🚩 Macro Target 2 - $422
🚩 Macro Target 3 - $638
- Not financial advice, trade with caution.
#Crypto #Litecoin #LTC #Investment
✅ Stay updated on market news and developments that may influence the price of Litecoin. Positive or negative news can significantly impact the cryptocurrency's value.
✅ Exercise patience and discipline when executing your trading plan. Avoid making impulsive decisions driven by emotions, and adhere to your strategy even during periods of market volatility.
✅ Remember that trading always involves risk, and there are no guarantees of profit. Conduct thorough research, analyze market conditions, and be prepared for various scenarios. Trade only with funds you can afford to lose and avoid excessive risk-taking.
