LTC ready for launchLTC is poised to break out for $99. It could even decouple with bitcoin and continue on its way. Not investment advice.
LTCUSDT trade ideas

LTC at a Double Resistance ZoneLTC at a Double Resistance Zone
LTC faced a double resistance zone on the 4-hour timeframe, located near 112.80.
The price has already moved down, and on the 60-minute chart, a small bearish pattern has emerged, indicating a potential further decline.
It appears that LTC may begin a bearish trend from this zone.
Key support areas: 95, 88, and 80.50
You may find more details in the chart!
Thank you and Good Luck!
❤️PS: Please support with a like or comment if you find this analysis useful for your trading day❤️

Ltcusdt Hello guys welcome. Here I allready share idea about ltc's chart . But seller taken control so until selling market control by seller.
About me- if you all guys like my prediction and interested than follow me and I will help who trap in any trade . Top 3 select guys I will predict thair trade and share.
Notic - all market are risky and this business is possiblety base. Not be sure but do most successful home work

Ltcusdt So hello guys welcome. Here I share my idea about Trend. So I am not giving suggestion any investment so invest on your risk. If you want to learn so keep follow me and and look at my prediction how to react market
So here is the LTC chart so I found the symmetrical pattern this pattern can move any direction after break out market moment so bullish expectation so very high the reason is buying zone so let's see what happen the chat after the break out and get the target

Litecoin (LTC): We Are Dropping / More Incoming!Litecoin has dropped 15% since our last look at the coin and now we expect the 100EMA to be broken, so we can fall further down!
More in-depth info is in the video—enjoy!
Swallow Team

Litecoin (LTC): Last Crash Before New ATH?We are seeing yet another rejection from upper resistance zone, which can send price back for another -20%...
More in-depth info is in the video—enjoy!
Swallow Team

Ltc bullish as soon as Hello guys welcome. Here I share a idea about trend. please before any investment research own your risk. This is ltc chart and buyer and seller very strong fight for market move. Here multi support but still waiting for buyer coming. So keep on eyes.

LTC Strong Support ZoneLTC is on strong support zone, but if can't go back to above 92, we can posible heading to 76
Litecoin (LTC): Possible Downward Movement of 15%After filling the CME gap, we are seeing selling pressure here, which might send the price back by 15%. So far we have had a decent rejection as well so keep an eye on further BoS on the 5M timeframe!
More in-depth info is in the video—enjoy!
Swallow Team

Litecoin (LTC): Might Push Towards CME / 16-17% MovementLitecoin has a chance of recovery, which would also fill that CME gap nicely. In addition to that, looking historically at the recovery of LTC, we see some quick movement!!
More in-depth info is in the video—enjoy!
Swallow Team

LTC LONG ALL trading ideas have entry point + stop loss + take profit + Risk level.
hello Traders, here is the full analysis for this pair, let me know in the comment section below if you have any questions, the entry will be taken only if all rules of the strategies will be satisfied. I suggest you keep this pair on your watchlist and see if the rules of your strategy are satisfied. Please also refer to the Important Risk Notice linked below.
Disclaimer

LTCUSDT Perpetual Contract - Potential Downtrend After Support B📉 Technical Analysis Overview
LTC/USDT (Litecoin) is clearly in a downtrend on the daily chart, with price recently breaking below the key support zone (around $100-$102). Currently, the price is consolidating below this level, indicating potential further downside risk.
🔍 Key Technical Points
✅ Support Breakdown:
• The previous $100-$102 support zone has been breached and may now act as a new resistance level.
• The price is currently trading below this area. If it fails to reclaim this level, it could confirm a break-and-retest pattern, favoring further downside.
✅ Volume Analysis:
• The breakdown occurred with increased selling volume, indicating strong bearish pressure.
• If a rebound occurs but lacks volume expansion, it suggests weak buying power and a continuation of bearish sentiment.
✅ Potential Target Levels:
• If the price continues trading below $100, the next major support levels are $87.68 and potentially $79.71.
• If the price reclaims $102 with strong momentum, it could test the resistance zone between $108-$112.
🚨 Trading Strategy Suggestions
🔸 Short Strategy:
• If the price retests $100-$102 and faces rejection, it could be an opportunity to enter a short position, with a stop-loss around $102.5-$103.0 and a target towards $87.68 or lower.
🔸 Long Strategy (Cautious Approach):
• If the price closes above $102 with strong volume, traders may consider a short-term long position, setting a stop-loss below $99 and aiming for $108-$112.
⚠ Risk Warning
The market is currently bearish, and traders should closely monitor price action around the $100 key level while managing risk properly!

#LITUSD 1DAYLITUSD (1D Timeframe) Analysis
Market Structure:
The price is currently testing a key support level, which acts as a critical decision zone. If the support holds, a bounce may occur, signaling a potential bullish move. However, if the price breaks below the support and retests it as resistance, further downside may follow.
Forecast:
- A buy opportunity may arise if the price shows a strong bounce from the support level.
- A sell opportunity could be considered if the support level breaks down and gets confirmed as resistance after a retest.
Key Levels to Watch:
- Entry Zone: A buy position can be considered if bullish confirmation appears at support, while a sell setup requires a confirmed breakdown and retest.
- Risk Management:
- Stop Loss: Below support for buy trades and above retest resistance for sell trades.
- Take Profit: Targeting key resistance levels for buy setups and lower support zones for sell setups.
Market Sentiment:
The market is at a critical level where price action confirmation is necessary. Traders should wait for a clear reaction at the support level before making a decision.

LTCUSDT 1WLTC ~ 1W Analysis
#LTC This support block continues to be maintained so far.
Buy gradually from here with a minimum target of 20%+.

LTC Long OpportunityMarket Context:
LTC is testing the range's low support level, which presents a strong buying opportunity if support holds. A potential bounce from this level could lead to a move toward the next resistance zones.
Trade Details:
Entry Zone: $102.00
Take Profit Targets:
$109.00 - $115.00
$132 - $140
Stop Loss: Just below $98.00
This setup offers a good risk-to-reward ratio, making it an attractive trade for a possible reversal. 🚀

Litecoin looks bullish!Trade setup: Price remains in an Uptrend. It got rejected at $140 resistance several times now. We would be buyers on pullbacks near $100 - $110 support range, which could be an attractive swing trade entry in Uptrend, with +30% potential upside back to $140. Stop Loss at $92.
Pattern: Price is Approaching Support, which is a level where it could pause or reverse its recent decline, at least temporarily. Support is often a level where price has bounced up in the past, or potentially prior Resistance level that was broken. (concept known as polarity). Once price breaks below support, it can move lower to the next support level.
Trend: Short-term trend is Strong Down, Medium-term trend is Up, Long-term trend is Strong Up.

Enter the channel aboveLitecoin etf news could send this cryptocurrency to the upper box. For higher targets, they have created a higher ceiling with a higher floor, so we hope for an uptrend.

LTCWaiting for the final wave C of the zigzag to complete. For further growth, it is crucial not to break the low of wave Y.
It's possible the zigzag is already finished, leading to an uptrend from here.

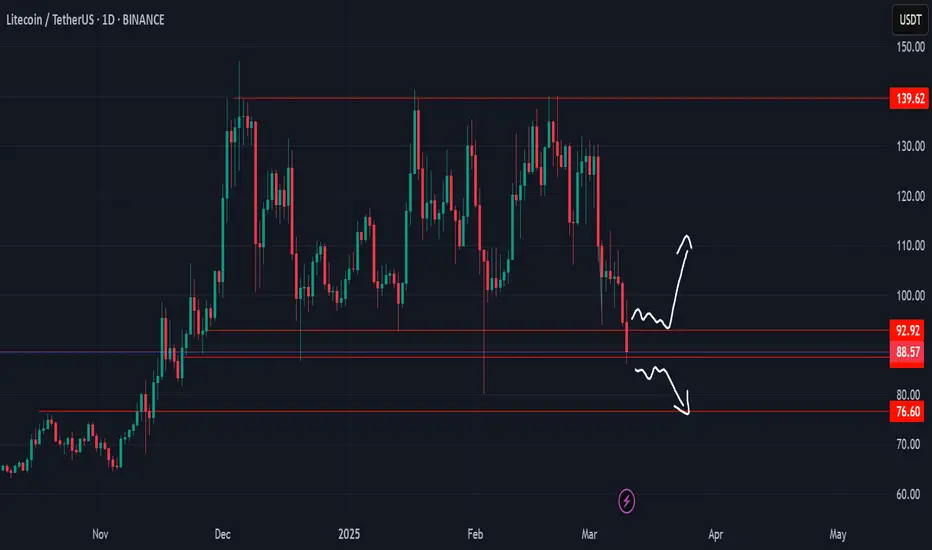
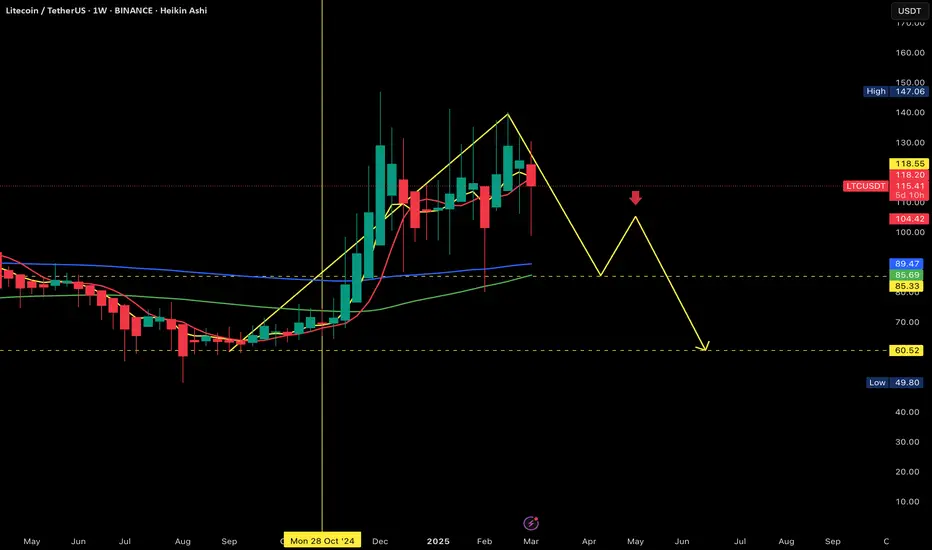
LTC WON’T SURGE YET: SHORT-TERM PRICE PATH AHEADLTC WON’T SURGE YET: SHORT-TERM PRICE PATH AHEAD
LTC isn’t ready for a big breakout. In the near term, expect it to dip to 89$, then rebound past 110$ before sliding back to 60$. This choppy ride reflects its weekly chart consolidation—stay sharp for the 89$ entry
LTCUSDT on the Edge – Major Breakdown or Fakeout?Yello, Paradisers! Is LTCUSDT on the verge of a major drop? The signs are stacking up, and if you’re not watching closely, you could miss a big move.
💎Right now, LTCUSDT is looking bearish as it forms an M-pattern near the resistance trendline of a descending channel. At the same time, a bearish divergence is confirming the weakness in momentum. On top of that, we’re seeing a triple-three wave pattern playing out, which further increases the probability of a downside move. All these signals combined suggest that sellers are gaining control.
💎If LTCUSDT breaks down and closes candle below the support level, the M-pattern will be validated, opening the door for a significant move lower.
💎However, if the price consolidates around this level without breaking down, the setup loses its strength, and in that case, it’s best to ignore it as a low-probability trade.
💎On the flip side, if LTCUSDT manages to break out and close candle above the resistance zone, the entire bearish outlook would be invalidated. In that scenario, waiting for fresh price action before making any moves would be the smartest approach.
🎖 Discipline and patience separate the pros from the amateurs. Stay sharp, Paradisers—trade only high-probability setups, and you’ll always stay ahead of the game!
MyCryptoParadise
iFeel the success🌴

Accelerated drop incoming ! Nfa My theory is ltc is in an abcde correction currently on the last leg down (E) and according to Elliot wave theory e wave can be equal to c or d and but wave E also can only retrace 61.8 or 78.6 percent of wave c or d according to Fibonacci levels so if that is so we could possibly see somewhere between 94-105 area of it goes 100% of wave c or d then we could possibly go under 80. I sold 2/3 of my positions yesterday still holding a 1/3 at an average of 114$ I have buy orders at 94$ and 80$ not financial advice i think this drop will be fast like the previous drop to 80 .

Litecoin bullish? Have you noticed the uptick in interest in LTC lately? No? People are buying it up.
See how it just touched the 0.702 again.. You cant make this shit up!
Have you bought some LTC??

LTC Update 1DThere is a relatively strong support in the range of $115 - $106 for LTC. As long as the price remains above this range, we can expect a significant upward movement for LTC 🫡🚀
