Litecoin / TetherUS forum

change it with uniswap and sushiswap..

🚨 Bullish Move Incoming | Layered Entries | Thief Trader Exclusive 🚨
The time has come for another high-stakes Thief Trading heist, and this time we're lockin' in on LTC/USDT – aka "Litecoin vs Tether" 💣💸
🎯 Thief’s Mission Plan: BULLISH AT ANY PRICE LEVEL!
We're going full stealth mode with a layering strategy — stacking multiple limit orders like a true pro thief preparing for a clean escape! 🔪📉📈
🚪 ENTRY: "Anywhere, Anytime" 🚪
📈 Buy from any price level — but for optimal entry:
🟢 Use Buy Limit orders near recent lows (15-30 min TF)
🔔 Don’t forget to set alerts for breakout confirmation!
🛑 STOP LOSS: Strategic Defense 🛑
🗣️ "Listen up, team! Stop loss ain’t a maybe — it’s your armor. Place it smart, or prepare for pain." 🔥
📍Recommended SL: 100.00
🔐 Adjust based on your lot size & how deep you stack your orders.
🏁 TARGET: 130.00 🏁
💸 But always Escape Early if the plan gets too hot!
Use a Trailing SL to lock in gains and slip out clean 😎🧨

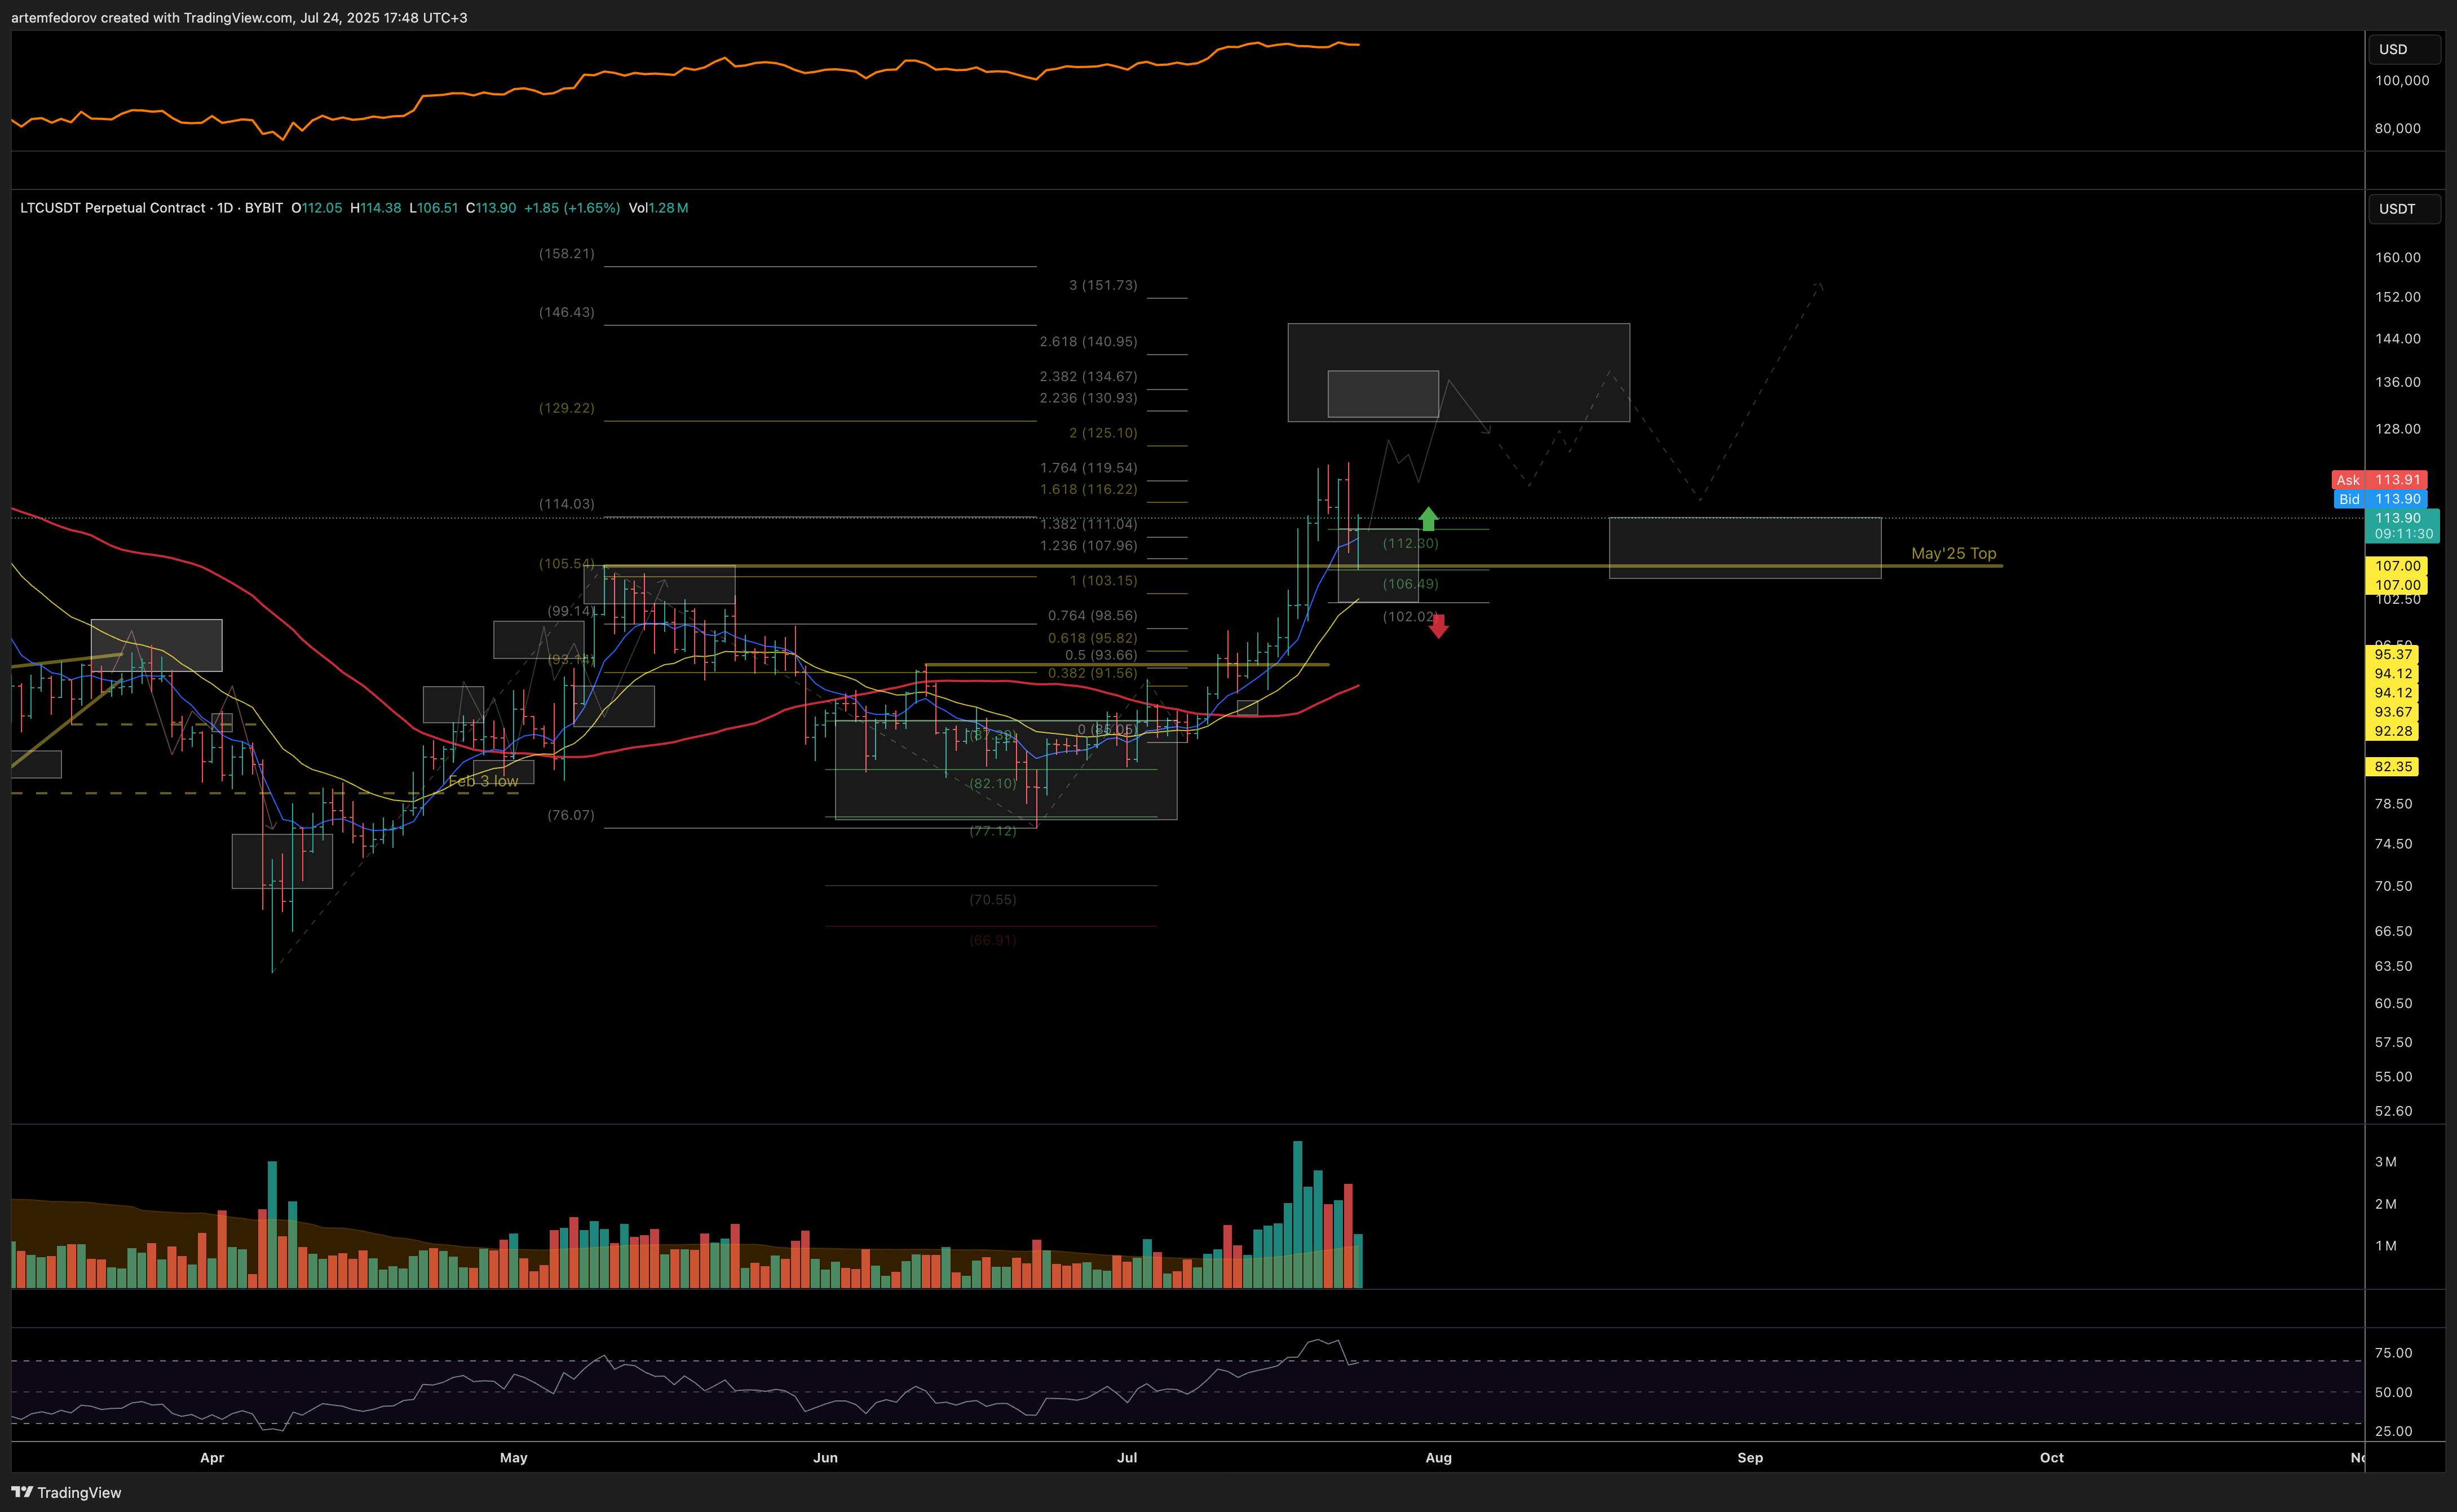
forming a positive falling wedge , nothing clear to enter now , but if we make new low and break 109$ in the next 2 days. it will be good entry targeting 120$

You know.
Really liking the price structure since the April and June bottoms. I wasn’t following it closely after the July breakout, but was actively trading it back in March — see the trade progression here:
Idea: LTC/USDT: at important resista…
As long as today’s low holds, I see immediate potential for a follow-through to the 125–130–135 resistance zone.
From a mid-term perspective, the structure and upside thesis remain valid above 100.
Chart: tradingview.com/x/xvrsRxnk/

LTC was rejected from the FVG (Fair Value Gap) formed during its previous impulsive move. Just below that lies an imbalance zone, which is likely to be filled first during any correction. If downward momentum increases, the price could slide toward $88, $87, and $86.
Currently, long positions seem risky. However, a short setup around $91 with a 3% profit target could be an option for risk-takers. I’m personally not opening any trade at this time, but short-term traders may consider it.
On the upside, LTC is still holding above its 200 MA, which is a positive technical indicator. If it manages to hold above $92.30, the next upside target would be around $95.
