Litecoin (LTC): Seeing Strong Upside Potential | Bullish TradeLitecoin caught our attention with a nice breakout and buy-side volume dominance, where we are seeing 2 good trades that can be taken, both with a decent R:R ratio.
More in-depth info is in the video—enjoy!
Swallow Academy
LTCUST trade ideas

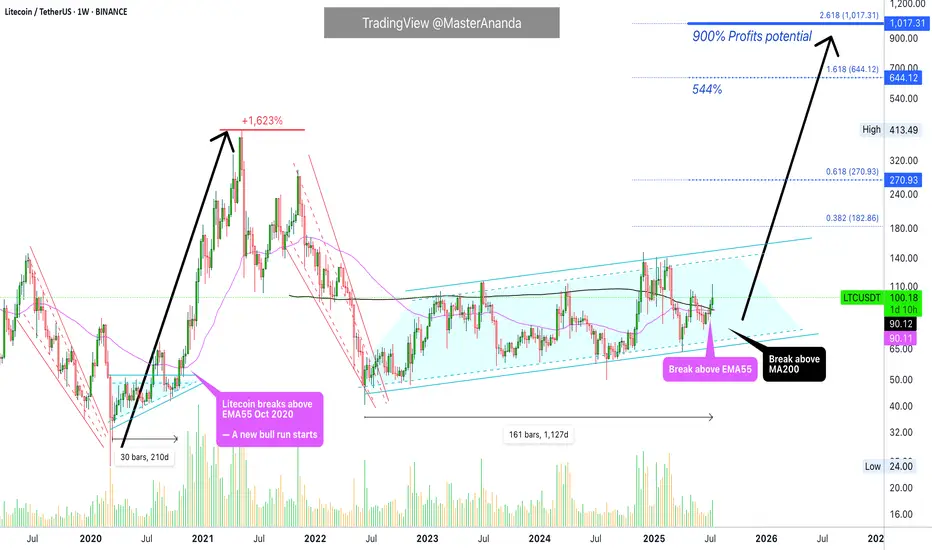
Litecoin $1,000 (900%) ExplainedBack in 2020, just 210 days of consolidation led to a 1,623% strong bull market. How much different market conditions we have now. Since 2022, Litecoin has been consolidating. The length of this consolidation is now 1,127 days. More than five times the previous consolidation and then some.
How much higher can Litecoin go compared to a past period?
How much more growth can a project produce when it has been building strength for so long?
LTCUSDT is now trading weekly above EMA55. When this happened back in 2020, what followed was sustained growth. Straight up, literally, for a period of 203 days. No stops.
Back in 2020, Litecoin moved above EMA55 first in August just to be rejected. The second time was the good one. This year the situation is the exact same. Litecoin broke above EMA55 in May and was rejected. The second time is happening now in July and this is the good one.
Litecoin is also trading above MA200 fully confirmed and there is a golden cross between EMA55 and MA200. We are very close to a major marketwide bull-run.
$644 in this bullish cycle is a high probability target for Litecoin, but prices can go higher, much higher because market conditions continue to improve and institutions will gain access to Litecoin through Exchange-Trade Funds (ETFs). This means that a standard price projection would be a disservice to us. We are aiming for $1,000+ on this bullish cycle but it can end up closing higher of course.
After the new all-time high is hit, it is normal to see a correction or even a bear market. This one should be short and small compared to previous ones. See you at 1K.
Namaste.
LTCLitecoin
An open source decentralised digital currency that enables fast and borderless transactions.
Everything is clear on the chart.
I wish everyone abundant profits.
Like and follow
for more.

LITCOIN BUY OR SELL !!!Hello friends🙌
🔊According to the price drop, you can see that the price has been below the specified resistance for a while and when it was able to break the resistance, it shows us the power of the buyers. Now, when we return to the previous resistance, which has now become a support, you can see that the buyers are providing good support and the price is expected to move to the specified targets.
Note that the most important rule in trading is capital and risk management So make sure to follow it.
🔥Follow us for more signals🔥
*Trade safely with us*

Litecoin: Major Expansion or Still Too Early?Price Action & Key Zones
Litecoin COINBASE:LTCUSD BINANCE:LTCUSDT continues to move within a multi-year consolidation range. The monthly chart clearly shows the range that has held since 2022. Key levels to watch:
Resistance at 145–150 USD — a key seller zone that has repeatedly acted as a reversal area.
Zone 150–180 USD — monthly imbalance, likely to serve as major resistance on breakout.
Range 195–270 USD — bearish order blocks, which will also act as overhead resistance.
On both monthly and weekly timeframes, LTC appears to be in a phase of accumulation or reaccumulation. A breakout from this structure will likely take time.
Wave Analysis: Two Scenarios
1. Base scenario : LTC is still forming a contracting triangle. Currently, it is developing wave D, which should test the monthly imbalance in the 150–180 range. After that, a correction in wave E (bearish phase) is expected, followed by a potential upward impulse.
2. Alternative scenario : the triangle is already complete, with wave E having formed at $62 in December 2024. A new upward expansion has begun. However, this version is not supported by the triangle’s geometry — none of its sides align with the 0.618 Fibonacci ratio. Also, proper distribution in such cases typically takes at least 6 months, and BTC might not have that much time left in its cycle.
Therefore, I stick with the base scenario: LTC is still in the accumulation phase.
Targets & Timing
Near-term targets: $107 → $128 → $147 (December high).
Maximum target for this cycle — $180, where a major reversal or distribution may occur.
On the 4H chart, a 5-wave impulse structure formed from April to May (likely wave A), followed by a sharp correction. Currently, wave C appears to be unfolding, and based on Fibonacci extensions, it could reach between $128 and $180.
Fundamental Drivers for Growth:
1. Litecoin remains a reliable payment network, offering fast transactions and low fees — often referred to as “digital silver.”
2. LTC mining is synchronized with BTC, making it a logical choice for certain miners.
3. In many regions, LTC is actively used for cross-border transfers and capital movement.
4. Undervalued compared to other altcoins, with no centralization concerns or SEC scrutiny — this could attract more institutional interest.
5. ETF Potential: after BTC and ETH, Litecoin could be the next natural candidate for a spot ETF. If approved, this could trigger a significant surge in interest and liquidity.

LITCOIN : So what is an ETF ?Hello friends
Be careful with the recent fluctuations of this coin because the movements of this coin have become unpredictable and we suggest that if you want to buy, buy in the specified support areas and in steps, of course with capital and risk management...
We have also specified targets for you.
*Trade safely with us*

LTC - Time to buy again! (Update)Finally, this pattern was broken and had a positive impact, leading to significant growth. Now, with a slight price correction, higher price levels can be reached.
PREVIOUS ANALYSIS
Best regards CobraVanguard.💚

LTCUSDT Short Risking 1% to make 2.22% BINANCE:LTCUSDT Short Swing Trade, with my back testing of this strategy, it hits multiple possible take profits, manage your position accordingly.
This is good trade, don't overload your risk like greedy, be disciplined trader.
I manage trade on daily basis.
Risking 1% to make 2.22% on COINBASE:LTCUSD is good trade, lets see.
Use proper risk management
Looks like good trade.
Lets monitor.
Use proper risk management.
Disclaimer: only idea, not advice

LTCUSDThe LTC/USDT pair currently trades at $74.77, positioning itself for notable bullish movements across various timeframes. In the near term, price targets are set around $90.00, reflecting immediate upside potential supported by strong technical signals and market dynamics.
Looking ahead to the medium term, targets extend to the range of $100.00 to $110.00. This forecast is underpinned by robust momentum indicators and bullish patterns suggesting sustained upward momentum.
For the long term, LTC/USDT could aim for $120.00, driven by favorable market conditions and ongoing adoption within the cryptocurrency ecosystem. Further out, targets expand to $150.00 to $180.00 by Q4, illustrating significant growth prospects backed by historical price trends and extended Fibonacci levels.
Investors and traders are advised to monitor key technical indicators, such as the moving average convergence divergence (MACD) and relative strength index (RSI), which affirm bullish sentiment and potential price appreciation. Risk management strategies should be implemented to navigate market volatility and optimize entry points aligned with support levels.
Continued vigilance on market developments and regulatory factors impacting cryptocurrencies will enhance decision-making processes and support strategic investment decisions

#LTCUSDT: On The Way To $200, Get Ready For Swing Buy! Hey there!
Evening Everyone,
The price of this crypto is currently in a bullish formation, and it looks like it’s on the rise, potentially reaching $200. The best thing you can do is wait for the price to break out of the downtrend and then keep going up. You could set a target at $150 and then $200, which would be a swing move.
Good luck and trade safely! 😊
Thanks a bunch for your unwavering support! ❤️🚀
If you’d like to lend a hand, here are a few ways you can contribute:
- Like our ideas
- Comment on our ideas
- Share our ideas
Cheers,
Team Setupsfx_

Your Biggest Trading Enemy Isn’t the Market It’s YouWhy do traders get liquidated right at the peak of confidence?
Is capital safety defined by charts or by our inner world?
Let’s dig deeper. The real threat doesn’t come from the market. It comes from within.
Hello✌
Spend 3 minutes ⏰ reading this educational material.
🎯 Analytical Insight on Litecoin:
BINANCE:LTCUSDT has recently formed a reliable inverse head and shoulders pattern near a strong support zone 📉. This technical setup indicates a potential upside of approximately 9%, targeting $95 in the near future 🚀. Traders should watch for confirmation and manage risk accordingly.
Now , let's dive into the educational section,
🧠 The Mind: The Most Dangerous Indicator in the Market
Before the market empties your wallet, it hijacks your mind.
You may think you’re entering a trade using your indicators, but more often than not, it’s your emotions pushing the buttons. Tools are just the excuse.
When you feel absolutely certain and think this time is different, that’s when you’ve probably entered the danger zone. The market thrives on exploiting emotional certainty.
Truth is, many losses come not from poor analysis but from repeating bad decisions out of anger, revenge, or stubbornness. If you don’t protect yourself from your own behavior, no strategy can protect your capital.
🧨 Overconfidence: The Greatest Liquidator
One of the most destructive feelings in trading is confidence without validation
After a few consecutive wins, your brain flips the switch and you feel invincible
Overconfidence tricks you into skipping stop-losses, overleveraging, ignoring timeframes, or ditching your strategy altogether. The end result is all your hard-earned profits vanish in a single emotionally-driven trade.
Confidence should be earned trade by trade, not assumed after a few lucky runs.
📉 TradingView Tools: Real Support or Mental Trap?
Let’s be real. Tools are powerful only if used with clarity
Try the Bar Replay feature to stress-test your setups without live risk
Use the Long Short Position tool to visualize your actual risk reward, not the one your ego wants to see
Set Alerts so that your entries are data driven, not emotion driven
These tools are your allies. But just like a sharp knife, they can cut the cook too. The problem isn’t the tool. It’s always the hand using it.
🪤 If It Feels Right, It’s Probably a Trap
One of the most common cognitive biases traders face is mistaking emotions for data
You might see price touch support, but deep down, you’re still haunted by that last failed bounce, so this time, you enter out of revenge. Or maybe everyone online is screaming pump and FOMO kicks in
At that moment, you’re not thinking. You’re gambling
The market doesn’t care how you feel. It only cares whether you’re reacting emotionally because that’s the easiest liquidity
🧩 Not Trading Is a Trade
Especially in crypto, traders with patience often outperform those who force constant action
Someone who watches charts for three days without entering may end up ahead of the one jumping into five trades a day
Discipline in waiting is a skill. Sometimes, the most profitable decision is simply doing nothing
Pro traders strike rarely but with precision. The rest is surveillance, not execution
🧠 Good Trading Means Being Rational in the Moment
Here’s what separates losers from winners
Losers make a decision and then look for justification
Winners seek solid logic then make a decision
If your mind is unstable, even the best setup can lead to chaos
But a clear mind can extract gold from even the simplest charts
🧬 Final Thought
If you're serious about protecting capital, start with protecting your mindset
Open positions, stop losses, and chart entries matter, but without internal stability, none of them will save you
In truth, the riskiest place for your capital is not the market. It’s you
✨ Need a little love!
We pour love into every post your support keeps us inspired! 💛 Don’t be shy, we’d love to hear from you on comments. Big thanks , Mad Whale 🐋
📜Please make sure to do your own research before investing, and review the disclaimer provided at the end of each post.

Litecoin (LTC): Really Good Buying Opportunity For July 2025 Litecoin has a really good chance to explode anytime now. We noticed a decent uptrend forming so what we are looking for is a break of that trend and full-scale upward movement!
More in-depth info is in the video—enjoy!
Swallow Academy

Litecoin:Is the main climb coming?hello friends👋
As you can see, the price, after falling in the support area specified by the buyers, has been supported and returned, forming an upward pattern.
Now we don't enter into a transaction with just one pattern, we also check the entry of buyers and the amount of currency and other factors and draw conclusions.
According to the points we have said, we have identified very important support points for you to buy step by step with capital and risk management and move to the specified goals.
🔥Follow us for more signals 🔥
*Trade with us safely*

LTC, he Hidden Strength Beneath the Retrace Ma dudes, we might just be witnessing something big and beautiful here. 🤌✨
Okay okay, I might sound like a total degen, but hear me out:
✅ Double bottom (check those two green arrows)
✅ Bullish divergence on the RSI
✅ MACD on the monthly just crossed bullish — for the first time ever on this pair!
✅ OBV stayed strong, didn’t collapse even during that nasty monthly retrace
✅ Notice how volume was climbing during the uptrend, but fell off during the retrace? That means the drop lacked real conviction.
We’re also sitting at an ATL (all-time low) — the lowest we've been.
Check out that red arrow pointing at the volume: that's the first sign of a burst. The next bursts? 💥 They should be explosive.
…And that’s just to name a few.
See you somewhere up there 🚀 — once we break through that T1 level, we should start trending higher fast.
That's it, that's the idea" - Good night !

LTC Swing Long Setup - Positioning Early for BreakoutLimit swing long placed on LTC based on consolidation above higher timeframe support and compression below a descending trendline. The setup targets a potential breakout continuation, with defined invalidation and a clear take profit ladder. Risk is tight, reward to risk is strong, and capital protection is included.
I am entering before full confirmation due to the price squeezing near support. I accept the chance of a failed breakout in return for early entry and better reward to risk.
The setup combines both daily and one hour timeframes. The daily shows structure holding above support and pressing into the trendline. On the one hour chart, the 0.236 Fibonacci level has held after an impulsive move, with high volume support around 84 to 85. A higher low is forming locally.
Limit Swing Long LTC.
Entry: $84.25
Stop-Loss: $81.70
Total risk: 1% of account capital.
TP1: $86.80 (30% – early profit, reduce risk). Move SL to $84.7.
TP2: $91.70 (40% – take out most capital)
TP3: $103 (20% – trend continuation)
TP4: $124 (10% – moonshot runner)
Take profit one locks in gains and reduces exposure. Take profit two is the main target near resistance. Take profits three and four aim for continuation if the breakout develops. Stop loss is placed below structural support and the 0.236 Fibonacci level, far enough to avoid noise but close enough to protect capital.
DISCLAIMER: I am not providing trading signals or financial advice. The information shared here is solely for my own documentation and to demonstrate my trading journey. By openly sharing my process, I aim to put pressure on myself to stay focused and continually improve as a trader. If you choose to act on any of this information, you do so at your own risk, and I will not be held responsible for any outcomes. Please conduct your own research and make informed decisions.

#LTC Update #4 – July 10, 2025🔵 #LTC Update #4 – July 10, 2025
LTC was rejected from the fractal resistance left behind during its previous impulsive move. Just below this level lies an imbalance zone, which is likely to be filled first during any correction. If the downtrend continues, price could move toward $88, $87, and $86 levels.
Currently, long positions seem risky. However, a short setup around $91 with a 3% profit target could be an option for risk-takers. I’m personally not opening any trade at this time, but short-term traders may consider it.
On the upside, LTC is still holding above its 200 MA, which is a positive technical indicator. If it manages to hold above $92.30, the next upside target would be around $95.

LTC - Litecoin - After the Short the LongAfter the short Signal on the AVWAP line we found buyers at the bottom.
1. PVR mountain shape is the first indication that buyers are coming in.
2. Abnormal SI 5.6 is what I call 1st Push Up.
Finally the entry Plutus signal PL.
You should be careful now because we are crossing Fib 61.8, get you profits sellers might be in that high volume bar. The reaction later waves will be indication if we are going to continue or reverse.
Enjoy Trading the Volume Wave and Speed Index!

#LTC Update #3 – July 8, 2025🔵 #LTC Update #3 – July 8, 2025
Litecoin continues its correction following the latest impulsive move. A strong resistance awaits at the $87.20 level, and breaking through it won't be easy. If price manages to close above $88.50 , a potential move toward the $92 zone may follow.
On the downside, if Litecoin pulls back below $82 , the next likely stop is around $77 . At this stage, I do not recommend opening any long or short positions. Observing the market is the better approach for now.

LTC- Litecoin Entered Short Reading the chart this is the story:
1. We had Significant Fib location where we found sellers visible at the top- the reaction after the up wave a large down wave.
2. Placed AVWAP at the beginning of the up-wave and waited for the price to cross downwards and the pull back so that AVWAP will act as resistance.
3. Pull Back to AVWAP came after some time
4. Price never breaks AVWAP upwards and it has hard time to move up - Abnormal SI of 4.9
5. Finally waited for a Plutus short signal and in this case it was a PRS.
Stop above AVWAP center line target at least 1:1.5
Enjoy!

#LTC Update #2 – July 5, 2025🟣 #LTC Update #2 – July 5, 2025
Yesterday, I pointed out that Litecoin was in a dangerous zone — not ideal for long or short entries. Since that update, LTC dropped another 4 percent, validating the caution I shared.
Right now, I still don’t see a clear opportunity for either direction. I believe LTC will make a decisive move within the next 24 hours, likely a sharp breakout or breakdown, unless a major external catalyst intervenes.
Here’s how I view potential support levels:
🔴 First stop: $85.5
🔴 Second stop: $82.5
🔴 Third stop: $77
Until direction becomes clear, I won’t be entering any trades. I’m watching closely.
If you're holding a profitable position, I’d consider taking partial profits here.

LTC Short SetupWait for the entry and execute, SL is smaller and if candle closes strongly above the zone then must close the trade. Hopefully it won't break easily this zone as bearish fvg + bearish order block lies here.

LTC Buy / Long SetupAs price wants to move in a range, SO that's another setup for LTC, invalidation is same as for short setup, candle closing below the mention zone immediately close the trade otherwise wick doesn't matter, wick do the damage body tells the story.

LTC/USDT Weekly – Massive Breakout Loading? 3-Year Triangle
📌 Litecoin is now standing at one of its most crucial technical levels since the 2021 bull run. After 3 years of compression inside a massive symmetrical triangle, price action is nearing a major breakout point. Will LTC finally explode upward, or are bears still in control? Let’s break it down!
🧠 Technical Pattern: Long-Term Symmetrical Triangle
This is a classic pattern that signals a prolonged phase of buyer-seller equilibrium, where lower highs and higher lows converge into a point of tension. Historically, this type of formation often ends in a sharp breakout in either direction.
🔺 Pattern Duration: Since May 2021
🔺 Converging trendlines: Tightening into Q3/Q4 2025
🔺 Historical breakout probability: ~60-75% chance of upward breakout in symmetrical triangles
🟢 Bullish Scenario (Upside Breakout):
If LTC breaks above the upper triangle resistance (~$100 – $115) with strong volume, it could ignite a major rally due to:
✅ The end of a multi-year consolidation
✅ Renewed investor confidence and potential altcoin season
✅ Technical confirmation of breakout from a long-term base
🎯 Upside Targets:
$134.66 – Psychological resistance and minor horizontal supply zone
$230.13 – Major resistance area from 2022 breakdown
$280.87 – Fib extension & key structural level
$325.00 – Pre-blowoff level from 2021
$387.91 – All-Time High (ATH) retest zone
📌 Based on the triangle’s base projection, a technical target of ~$280+ is plausible if breakout confirms.
🔴 Bearish Scenario (Downside Breakdown):
If LTC fails to hold the rising support (~$85), it may trigger a strong bearish reaction, especially if Bitcoin also loses key support levels.
📉 Downside Levels to Watch:
$65.00 – Key horizontal support
$49.00 – $39.00 – Historical demand zone from early 2020
$23.90 – Pandemic-era low (extreme bearish target)
📌 Breakdown confirmation requires a weekly close below support with high volume, ideally accompanied by macro risk-off sentiment.
🧩 Key Confirmations to Watch For:
1. Volume Surge on Breakout – Is the move supported by strong volume?
2. Successful Retest – Does price retest the breakout level as support?
3. Momentum Indicators – Weekly RSI > 50 and MACD bullish crossover can strengthen conviction.
📊 Fundamental & Sentiment Context:
Litecoin halving occurred in August 2023. Historically, price rallies follow 6–12 months after.
Often dubbed the “digital silver”, LTC remains relevant during altcoin cycles.
Whale accumulation has increased slowly since late 2024—possibly indicating long-term positioning.
✅ Conclusion & Strategy:
Litecoin is like a technical time bomb waiting to explode. Traders and investors should prepare for both breakout and breakdown scenarios. Patience and confirmation are key. Don’t chase—let the chart speak first.
🎯 Plan the trade, trade the plan. Don’t FOMO into noise—wait for structure!
#LTCUSDT #LitecoinBreakout #CryptoTechnicalAnalysis #SymmetricalTriangle #BullishSetup #AltcoinSeason #Litecoin2025 #CryptoChart #TrianglePattern #LitecoinRally
