Lite up and let lite do the workHi
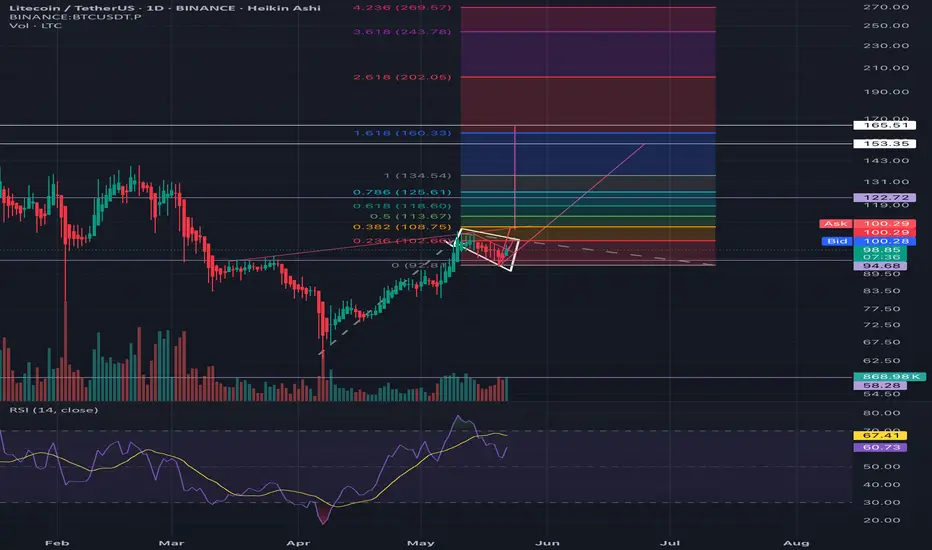
Bullish flag target and inverse head and shoulders are close to the fib 1.618. Where reversals tend to happen
On thee daily perspective we are starting a new green candle at support after the retracment if we switch to hekin ashi candles which furthermore increases the chances of a. Bullish move
LTCUST trade ideas
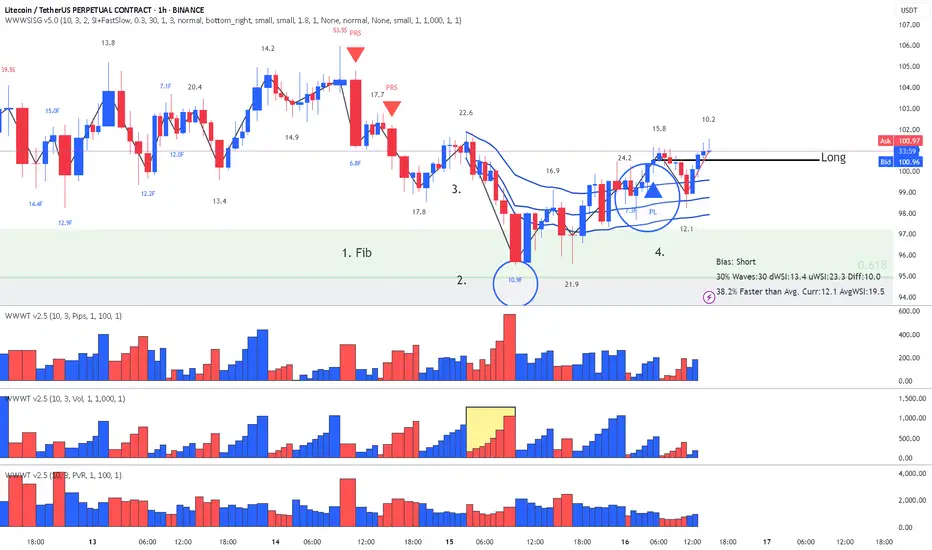
LiteCoin-LTC Lesson 15 said Long - This is why!Lesson 15 Methodology chart reading:
1. Fib Location (buyers might enter here)
2. Largest down volume wave (buyers could be in there) with increasing PVR
3. Placed AVWAP at the beginning of the down wave and wait for price to cross upwards, wait for a pull back and a Plutus Long on the pull back.
4. Entry Long on the PRL signal.
Enjoy!

LTC Shows Weakness – Another Drop Ahead?LTC Shows Weakness – Another Drop Ahead?
On the 60-minute chart, Litecoin (LTC) is moving down in a choppy way, making new lower lows and pulling back deeply each time.
This pattern has happened before, and it looks like it might continue.
There's a good chance LTC will go through another downward wave soon.
The target price levels—92.60, 91.00, and 89—could also be areas where the price might bounce back up, just like it has in the past.
You may find more details in the chart!
Thank you and Good Luck!
❤️PS: Please support with a like or comment if you find this analysis useful for your trading day❤️

LTC will this Demand Zone Trigger a Reversal or a Full Crash?Yello,Paradisers! Is this the calm before a major bounce, or the final warning before Litecoin breaks down completely? This current zone is absolutely critical ignore it, and you risk missing the next big move.
💎#LTCUSDT has completed a strong 5-wave impulsive move within an ascending channel. The recent correction has now brought the price back down into a very important demand zone near $90. This level isn’t just a random number it’s sitting right on top of a previous major support zone that held back in early April, just before the entire leg up began.
💎Price is now also testing the lower boundary of the ascending channel. As long as #Litecoin holds this demand zone between $90 and $93, the bullish structure remains intact. This could be the perfect reload zone for bigger players preparing for the next leg up. If the price begins to form higher lows from here and reclaims the $96–98 region with strength, it could open the path toward the moderate resistance at $110. And if that level breaks with momentum, we’re likely looking at a full extension into the major resistance above $115.
💎However, if #LTC closes a candle below major support at $80 with volume and structure confirming the breakdown, the setup will be invalidated. In that case, we’re potentially heading for a much deeper flush into the $72–75 range, which aligns with the next HTF liquidity pool and potential weekly support.
Stay sharp, Paradisers. The market will soon decide and if you're ready, you'll be on the right side of the move.
MyCryptoParadise
iFeel the success🌴

Litecoin ($LTC/USDT) Long-Term Breakout Watch:$LTC/USDT Long-Term Breakout Watch:
LTC is trading in a wide horizontal range on the weekly timeframe, supported by a gradually rising trendline. This reflects long-term accumulation behavior.
🔸 Key Support Zone at $65 :
This ascending trendline has held consistently since 2018, confirming a long-term bullish structure with higher lows forming over time.
🔸 Upside Target: $350+
Upon breakout above the $138 horizontal resistance (blue line), the measured move could target $250–$350 based on historical breakout moves and pattern size.
🔸 Risk Level at $65:
A weekly close below $65 would invalidate the bullish structure and suggest further downside, potentially retesting previous lows.
🔸 Outlook:
Accumulate on dips above $85–$90, while respecting the trendline.
Watch for a clean breakout and retest of the $138 resistance zone before going full risk-on.

LTCUSDT 1D Analysis LTC ~ 1D Analysis
#LTC Buy after successfully breaking this resistance line or buy when retesting this support block with a short term target of at least 10%+.

Litecoin long to $107.1 todayThis trade idea is late as I have been busy but one can still get 3rr plus from it at current price with stop at $97.67
Time sensitive

Is Litecoin Revealing Some Marketwide Bullish Tendencies?This time we will look up-close at Litecoin, its price action.
This week is coming to an end. This week is the "pause" week. Week after week, we get an advance followed by a pause. If the same pattern continues to repeat we are set to experience higher prices.
Here is the weekly chart, let me know what you see in the comments:
Pretty interesting right?
There is more.
Now we will consider the daily timeframe.
Litecoin's price is really strong.
A retrace tends to balance out a rise. If it is a small rise, we get a small retrace. If we have a strong rise, we get a strong retrace. If the rise is quick, the retrace should also be quick, etc.
Let's start with the chart:
The previous retrace lasted five days from peak to bottom. The current retrace so far is in the same state. A peak 10-May and a low 15-May. The low 15-May produced a hammer candlestick pattern. This can support the retrace being over but this is super short-term.
The price is really strong and this is something that favors the bulls. No significant retrace after more than 70% growth means that bullish action is only getting started.
The first retrace activated the 0.382 Fib. retracement level. The second retrace activated 0.5. The current retrace activated the 0.382 level again. This goes in perfect balance with bullish dynamics.
When the market is bullish and rising, retraces tend to stop at the 0.382 Fib. retracement level and sometimes reach 0.5. When the market corrects to 0.618, 0.786 or lower, we are looking at a correction and this tends to happen only after a very strong rise.
Here we also have a bull flag and a strong daily RSI at 61.
What one does the rest follows. So, if Litecoin is pointing toward a continuation, I believe Bitcoin and the other Altcoins will do the same.
Namaste.

Litecoin shortEntered #litecoin short . I think it will eventually fall to $95 however, am looking to scale out before then.
Stop: $102.02
Tp1: $97.34...50%
Tp2: $97...25%
Exit at $95.6

LTC-USDT 1W chart ReviewHello everyone, let's look at the 1W LTC chart to USDT, in this situation we can see how the price approached the upper limit of the inheritance trend channel, only when it manages to get out of it, the price will be able to go further towards the inheritance trend line.
Going further, let's check the places of potential target for the price:
T1 = $ 105
T2 = $ 115
Т3 = 129 $
T4 = $ 147
Let's go to Stop-Loss now in case of further declines on the market:
SL1 = $ 97
SL2 = 80 $
SL3 = $ 63
Looking at the RSI indicator, we see
As he approached the center of the range, but we still have enough space for the price to definitely move up.

LTC longLTC chopping around range mid, Monday low reclaimed. If whole market is due for a move up I think LTC should run to Tp1 ultimate target Tp3 range mid.

LiteCoin -LTC - Lesson15 Methodology Signaled LongChart reading using Lesson 15 methodology:
Annotations in sync with chart
1.Location : Fib 50-61.8 are (an area that buyers can step in)
2. Fast Down Wave with SI 10.9
3. Placed AVWAP at the beginning of fast down wave and wait for price to cross upwards and pull back to it.
4. Wait for a Plutus Long signal to enter and in this case it was a PL.
Enjoy!
LTC/USDT 1-Hour Chart – Symmetrical Triangle Alert! Litecoin is gearing up for a big move on the 1-hour chart!
We’ve got a textbook Symmetrical Triangle forming, with LTCUSDT squeezing tighter and tighter between converging trendlines. The price is now approaching the upper resistance of the triangle around $104. This setup is screaming breakout potential!
If LTC clears the triangle’s resistance, we could see a strong push toward the $111.01 target — a key resistance level to watch. On the flip side, if it fails to break out, the $92.16 level (now potential support) will be critical to hold. Volatility is coming, and I’m ready for it — are you? Let’s see if Litecoin can spark a rally!
Key Levels to Watch:
Support: $92.16 (previous resistance, now support)
Resistance: $104 (triangle upper boundary)
Target: $111.01 and $125 (next major resistances)
What’s your take, traders? Are we breaking out or pulling back? Drop your thoughts below!

LTCUSDTThere is flag structure but i dont believe this kind of structure works well. that why maybe we can fall bearish mitigation and with power we can rise to above mitigation. let see!!

LITCOIN SIGNALSHello dears
You see that after a good growth, the price was in a range and then we had a decline until the support area was identified, which is also a good area and it was able to record a new ceiling, which is a good sign. Now the best and least risky thing is to buy steps.
We have identified the buying steps for you and the targets...
Note that this analysis is in daily time and may take a while, so if you are not patient, do not enter.
*Trade safely with us*

LTC Weekly Setup – Mid-Line Break Could Fuel More Upside📈 LTC – Weekly Chart Update
LTC is trading within an ascending channel and has just crossed above the mid-line ✅
If price holds this zone, the next target could be the upper trendline resistance 🔼
👀 Momentum is building—keep a close watch for continuation signals!

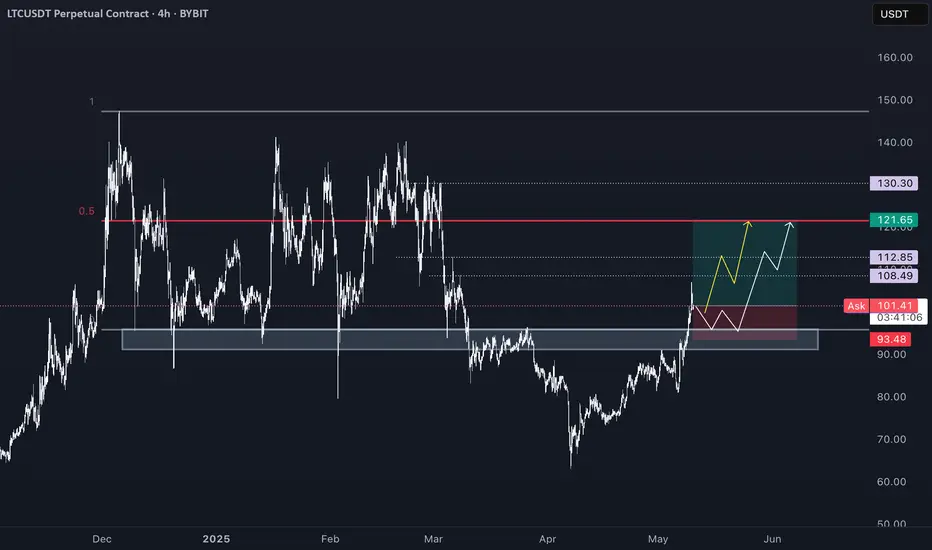
LTCUSDT | Long Bias | Major Support | (May 12, 2025)LTCUSDT | Long Bias | Major Support + Spot Buy Interest | (May 12, 2025)
1️⃣ Short Insight Summary:
Litecoin has been in a long downtrend since 2021, but price action is now approaching a major historical support zone. Spot buyers are stepping in, and this could set up for a strong bounce if confirmed.
2️⃣ Trade Parameters:
Bias: Long
Entry: Around $90–$92 (support zone near the bottom of the parallel channel)
Stop Loss: Below $90 or structure invalidation
TP1: $125
TP2: $144
Final TP: $181–$267 (for optimistic scenario)
Partial Exits: Recommended at each target level
3️⃣ Key Notes:
✅ Price is at the lowest levels seen since the major drop, with spot interest building up—potential signal for a bottoming move.
✅ We're currently moving within a parallel channel, and the lower band is acting as strong support.
✅ 12-hour chart shows the most relevant structure, and volume shows early signs of potential accumulation.
❌ Confirmation is still needed—watch for strong bullish reaction or high-volume push to validate the entry.
4️⃣ Optional Follow-up Note:
Will be watching closely to see if the $90–92 zone holds and shows strength. Plan is to enter long there and manage risk through partial take-profits.
Please LIKE 👍, FOLLOW ✅, SHARE 🙌 and COMMENT ✍ if you enjoy this idea! Also share your ideas and charts in the comments section below! This is best way to keep it relevant, support us, keep the content here free and allow the idea to reach as many people as possible.
Disclaimer: This is not financial advice. Always conduct your own research. This content may include enhancements made using AI.

Valuable Demand Zone Amid Weak Market ConditionsLTCUSDT Analysis: Valuable Demand Zone Amid Weak Market Conditions
I believe the blue box in LTCUSDT is highly valuable as a demand zone. Given the overall market conditions are not strong , I’ve identified a lower entry point that aligns with more favorable risk-reward scenarios.
This blue box stands out due to its significance from multiple perspectives . I used heatmap , cumulative volume delta (CVD) , and volume footprint techniques to accurately define this zone as a potential buyer area.
Key Points:
Market Conditions: Currently weak, favoring conservative entry levels.
Blue Box: A carefully identified high-value demand zone.
Techniques Used: Heatmap, CVD, and volume footprint for precise demand mapping.
If you'd like to learn how I use these advanced techniques to define accurate demand zones, just DM me!
If you think this analysis helps you, please don't forget to boost and comment on this. These motivate me to share more insights with you!
I keep my charts clean and simple because I believe clarity leads to better decisions.
My approach is built on years of experience and a solid track record. I don’t claim to know it all, but I’m confident in my ability to spot high-probability setups.
If you would like to learn how to use the heatmap, cumulative volume delta and volume footprint techniques that I use below to determine very accurate demand regions, you can send me a private message. I help anyone who wants it completely free of charge.
My Previous Analysis
🐶 DOGEUSDT.P: Next Move
🎨 RENDERUSDT.P: Opportunity of the Month
💎 ETHUSDT.P: Where to Retrace
🟢 BNBUSDT.P: Potential Surge
📊 BTC Dominance: Reaction Zone
🌊 WAVESUSDT.P: Demand Zone Potential
🟣 UNIUSDT.P: Long-Term Trade
🔵 XRPUSDT.P: Entry Zones
🔗 LINKUSDT.P: Follow The River
📈 BTCUSDT.P: Two Key Demand Zones
🟩 POLUSDT: Bullish Momentum
🌟 PENDLEUSDT.P: Where Opportunity Meets Precision
🔥 BTCUSDT.P: Liquidation of Highly Leveraged Longs
🌊 SOLUSDT.P: SOL's Dip - Your Opportunity
🐸 1000PEPEUSDT.P: Prime Bounce Zone Unlocked
🚀 ETHUSDT.P: Set to Explode - Don't Miss This Game Changer
🤖 IQUSDT: Smart Plan
⚡️ PONDUSDT: A Trade Not Taken Is Better Than a Losing One
💼 STMXUSDT: 2 Buying Areas
🐢 TURBOUSDT: Buy Zones and Buyer Presence
🌍 ICPUSDT.P: Massive Upside Potential | Check the Trade Update For Seeing Results
🟠 IDEXUSDT: Spot Buy Area | %26 Profit if You Trade with MSB
📌 USUALUSDT: Buyers Are Active + %70 Profit in Total
🌟 FORTHUSDT: Sniper Entry +%26 Reaction
🐳 QKCUSDT: Sniper Entry +%57 Reaction
I stopped adding to the list because it's kinda tiring to add 5-10 charts in every move but you can check my profile and see that it goes on..

Litecoin just broke every major EMA on the D1 — in one candle.LTC just broke every major EMA on the D1 — in one candle.
Reversal confirmed. Momentum ignited.
$100 is the new battleground.
Break and hold → next stop $120–$130
Don’t sleep on #Litecoin

LTC Mid Term Analysis As far as I can see, Litecoin is still moving within a wide channel that has remained reliable for years.
If you ignore the volatility and short-term fractals, Litecoin has consistently provided profits to early investors who were patient enough to wait.
Before this summer, I anticipate that LTC will reach at least $100 to $106.
The main target should be much higher, but predicting the future is a bit more difficult at the moment.
Due to new U.S. policies and other fundamental events, the target price should be kept at moderate levels for now.

LTC long Range reclaim, onto range mid or back down to range lows build a base and pump from there, weekend trade
LTCUSDTThe current outlook on $LTCUSDT.
This is not in anyway a financial advice, pls apply proper risk management

LTC Breakout : $93 Battle Could Unleash $97-$100 Surge!🔥 LTC Breakout Alert! 🚀 Litecoin is battling resistance at $93—smash through and hold, and we’re eyeing a massive jump to $97-$100! 📈 This could be the perfect long setup if it sticks! Don’t miss out, traders—watch closely! 👀💥
