LTCUSDT Sell Limit we see consolidation on Litecoin 101.53 is sell limit level, TP around $92,50 ... Hope all moves will be bullish in crypto world...
LTCUST trade ideas

🚀 Seizing Opportunity: A Strategic Approach for Buying LitecoinLet's embark on a thrilling journey through the intricacies of LTCUSDT! 🚀 Join me as we dissect its price movements, uncover potential patterns, and reveal the hidden gems that could drive your crypto portfolio to new heights. Get ready for an in-depth analysis that's packed with insights and tailored just for you
Welcome to my channel! Dive into the world of cryptocurrency with daily technical analysis, where we explore the latest market trends and uncover potential opportunities. From Bitcoin to a wide range of altcoins, I'm here to provide you with valuable insights and predictions to empower your investment decisions.
Please remember that crypto technical analysis is a powerful tool, but it's not infallible. It's essential to consider a holistic approach to your investments, taking into account factors like overall market trends, economic conditions, and information dissemination. This channel is dedicated to expanding your knowledge and fostering meaningful discussions.
Join me for the most up-to-date analyses, and don't forget to engage in the conversation in the comments section below! Remember, this content is for informational purposes only and should not be considered financial advice. Always use it as a part of your broader investment strategy."

Litecoin back to $120Litecoin rebalancing old inefficiency below liquidity pool.
Ready to send it to 120$ next i think

LTC Short-Term 1HIntervalHello everyone, let's take a look at the LTC to USDT chart on a one hour time frame. As you can see, the price is moving above the local downtrend line.
After unfolding the Fib Retracement grid, we can determine a support zone from $63 to $62, then we have a second zone from $60 to $59, and then strong support at the price of $57.
Looking the other way, we see that the price is struggling with the resistance zone from $64 to $65, then we have resistance at $67, and then strong resistance at $70.
Looking at the CHOP indicator, we see that there is still some energy to continue the upward movement, while the RSI indicator is approaching the upper limit, but we also have some room to go higher.

LTCUSDTLTCUSDT has given the breakout from long term declining trendline and started new bullish trend.
As the market is consistently printing new HHs and HLs.
A retest of previous broken structure is due, if the market successfully sustain the retest it could be a nice buying option .
what you people think of this idea ?

Litecoin longLitecoin broke trough the resistance level. Asset broke trough the descending trendline. Bullish movement to resistance level at 68.6 is possible.

LTC☀️ Ahead - Slightly Bullish Market; Yet, 🌧️ Week for Crypto Clouds and rain ☔ forecast for the global crypto market in the next 24 hours and week as bond yields surge to decade highs. Bearish sentiment looms for crypto coins.
Litecoin and Chainlink, however, bring a glimmer of ☀️, hinting at a slightly bullish trend.
Follow us for more crypto weather reports!

#LTCUSDT #LQR #TOBTC #LaqiraProtocolThe price is below the dynamic resistance. If the price is confirmed from this Level or within certain limits. you can open a trade after confirming and matching with Bitcoin levels. This analysis is not an offer to buy or sell.

LTC/USDT Where Now? Hey traders👋
LTC coin is next on our watchlist with a nice potential for some further bearish movement here.
You ask us why? Well first of all LTC had recently small recovery from "Oversold" zones near RSI but after getting rejected at 20EMA indicators seem to be going for another further drop here! which shows lack of volume on bullish side! So we are keeping our eyes on that lower "liquidity grab" zone for potential buy order!
If you like ideas provided by our team you can show us your support by liking and commenting.
Yours Sincerely,
Swallow Team
Disclamer:
We are not financial advisors. The content that we share on this website are for educational purposes and are our own personal opinions.

LTC/USDT 4H Chart ReviewI invite you to review the LTC to USDT chart also on a four-hour interval. At the beginning, we can use the blue lines to mark the downward trend channel in which we move along the lower border.
Let us now move on to determining supports for the LTC price in case the current correction deepens and here we can notice that we are at the support level of $59.12, but if we break out of it below, the next support will be at $55.99.
Looking the other way, similarly using the fib Retracement tool, we can determine the resistance areas that the price must face. And here we see that the first resistance zone is from $61 to $63, then we have the second zone from $64 to $66, then resistance at $68.18, and then strong resistance at $70.69.
The CHOP index indicates that the energy has been used up and is slowly growing, on the RSI we exceed the lower limit, which may end the current correction or slow it down, while looking at the STOCH indicator we see that the energy is running out, which can also give us a moment of rest before further movement.

LTC: Support BreakoutLitecoin (LTC) technical analysis:
Trade setup : Following a bearish breakout from a Channel Down pattern, price has now also broken below $65 support zone, resuming its downtrend. That support area held up recently in August but also in March and Dec 2022, thus its significant sign of weakness to see that level broken. Price could revisit $50 support next.
Trend : Downtrend across all time horizons (Short- Medium- and Long-Term).
Momentum is Mixed as MACD Line is above MACD Signal Line (Bullish) but RSI < 45 (Bearish).
Support and Resistance : Nearest Support Zone is $65, which it broke, then $50. The nearest Resistance Zone is $75 (previous support), then $100.

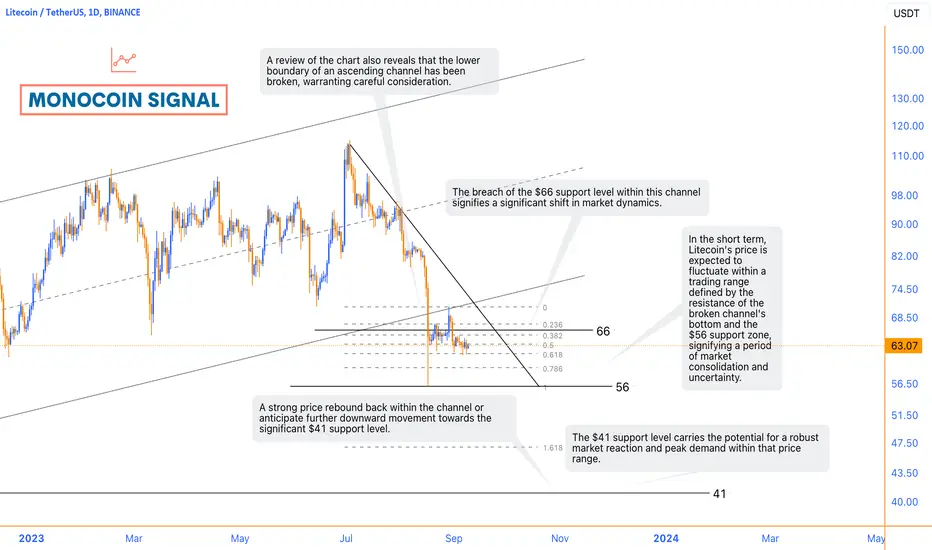
Recent Trends and Key Support LevelsOver the course of the last month, Litecoin (LTC) has persistently followed a declining trajectory within a short-term channel. This downward movement has notably coincided with a surge in selling pressure across the broader market. This alignment of factors has led to a significant breach of the channel's bottom, effectively breaking through a support level that was previously deemed sturdy at around $66.
In addition to this breach, an examination of the chart reveals that even when considering the presence of an ascending channel, the lower boundary of this channel has been breached as well. This dual breach prompts us to carefully assess the current situation.
In light of these developments, there are two primary courses of action that traders and investors should contemplate. Firstly, we may opt to patiently await a robust resurgence in Litecoin's price that brings it back within the confines of the channel. Alternatively, we could also consider the possibility of the ongoing downward trend persisting, potentially leading the price towards the support level situated around $41.
It's important to note that this $41 support level carries significant importance, as it possesses substantial potential for a strong market reaction. In such a scenario, demand for Litecoin could surge, possibly reaching its highest point in this specific price range.
In the short term, we anticipate Litecoin's price to exhibit a trading range, oscillating between the resistance formed by the previously broken channel's bottom and the support zone around $56. This range-bound movement signifies a period of uncertainty and consolidation in the market, as traders assess the evolving dynamics of Litecoin's price within the context of the broader market conditions and prevailing trends.
LTCUSDT Sell LimitLitecoin Strong OrderBlock on Supply level. Sell Limit is placed on 67.60 SL 68.43, Hope Bears are strong enough to stay strong on this level...

LTC - Daily Timeframe Update - True Halving After EffectWhen you see how price react to our previous analysis perfectly you wouldn't want to miss this train again.
I believe there is one last low to be created around $52 - $45 and then bulls will reclaim their mandate (Halving After Effect). The last time when the crowd thinks its null time immediately after halving, I said it's bearish now they've given up I say it's about to be bullish.
Let me know how often you want me to keep updating this chart in the comment section and what you think. turn on notification and follow so you don't miss any update too.


LTCUSD ❕ support zoneThe asset is confidently holding the current support area.
The price chart has clearly marked the borders of the current zone.
Trading volumes remain stable.
I believe that the asset will start to grow after fixing above the support zone.
