LTC Buying Here at $123 | BTC | ETH | DOGE | TRUMPLTC is strong candidate till now
we are buying here with stop loss closing below 120
BTC is at 200DMA and should hold at least for now
LTCUST trade ideas

TradeCityPro | LTCUSDT Let's go for spot buying?👋 Welcome to TradeCityPro Channel!
Let's go together to analyze and review Litecoin analysis, one of the oldest coins in the market, and let's go to update the triggers of the previous analysis!
🌐 Overview Bitcoin
Before starting today's altcoin analysis, let's look at Bitcoin on the 1-hour timeframe. Since yesterday, Bitcoin experienced a correction, which was necessary for the market, and it pulled back to the 102135 range. The next trigger for a long position will be a breakout above 104714.
Yesterday's correction, coupled with an increase in Bitcoin dominance, caused noticeable declines in some altcoins. This highlights the importance of monitoring BTC pairs in your checklist these days.
📊 Weekly Timeframe
On the weekly time frame, it is one of the coins that is in a good position compared to the coins and has had the least correction in recent declines and is in this position due to the possibility of ETF approval
There is no need to complicate things in this time frame and after the break of 136.45, we will buy and be above 98.44. This trigger is valid and we do not have much of an exit trigger for the conditions of these days on this chart and for now it is better to continue holding
📈 Daily Timeframe
On the daily time frame, we are also in a good position and we had a good return after the recent market decline due to the Bybit hack and Trump's tariffs and this is a good thing!
After breaking the 75.01 level and exiting the daily box and breaking its ceiling, we moved up to the resistance of 136.45 and are now fluctuating between the 98.44 to 136.45 boxes.
We also had a curve line in this time frame that was a good support for this event and every time we hit it, we made a good move upwards, but after its failure, it can be said that the upward trend moved into the range and went to form a new structure.
To buy spot after the 136.45 trigger is broken, we can buy for spot with a stop loss of 98.44 and as long as we are above 114.38, the 136.45 trigger is very important for us and it shows us more the strength of buyers and in case of a 98.44 break, we will go for 89 and 80 and we will have a price correction.
📝 Final Thoughts
Stay calm, trade wisely, and let's capture the market's best opportunities!
This analysis reflects our opinions and is not financial advice.
Share your thoughts in the comments, and don’t forget to share this analysis with your friends!

Litecoin Update Including 1,300% Target From Bottom-UpThis is Litecoin on the weekly timeframe and nothing changes; super, hyper bullish.
First, notice the volume, it continues to rise. The last two weeks produced the highest volume ever and this is the best signal you can find. Volume is the most important signal to confirm the validity of a move.
Second, notice the current weekly candle. There is a very long lower wick (shadow), and the action moves back above support. This is a very strong signal, why? There was much selling, really strong selling pressure but buyers showed up and bought everything. If the week closes at current price, we have a bullish signal in the form of a hammer. If it closes higher, even a stronger bullish signal. If it closes lower, the bullish bias remains intact because the action is very strong compared to the early February wick low.
The early February low hit $80. Litecoin is currently trading at $127.
I updated this chart to show more long-term, real and reasonable, targets. We have a target around $450 for 250% and another one at $707 for more than 450%. Now, this potential is because Litecoin is already pretty advanced in its bullish cycle since it has been growing since August 2024.
If we consider growth potential but starting from the market bottom, we are looking at 800% and 1,300% or more. It is likely that Litecoin will peak much higher, but we have time to adapt to how far high prices will go. Right now, the wise move is to buy and hold.
Buy and hold will take care of everything. Leverage can be used but it should be very low. It is better to earn a safe and secure 500%, than to go for a risky 5,000% and lose everything along the way. Don't get me wrong, leverage trading is an amazing tool but it should be used with caution. If you are buying Crypto to change your life, to live in abundance and be rich, you are better up buying and holding and increasing your money slowly but surely. In 2025 we will all win.
Thank you for coming back and for deciding to read.
It is my pleasure to write for you.
Thanks a lot for your support.
Namaste.

Litecoin Bullish Setup
CRYPTOCAP:LTC has broken out of the falling wedge and successfully retested the breakout zone
The price is currently consolidating above key support and showing signs of strength
A continuation of this move could push Litecoin towards its major target at $176.42
Key Confirmation: Holding above $118 support will validate this bullish scenario

LTC LONGTaking a slightly risky long at the CMP of LTC, it has a very good and stable volume as well as following a clear uptrend structure with stable and fast fills of LTF FVGs as well as reclaiming EMA levels and turning bullish on both LTF and HTF. GL!

LTC TA (educational)Some TA and levels were given days ago.
We took a short and got about 5%.
But the green support box and monthly were really good levels.
Follow for more ideas/Signals. 💲
Just donate some of your profit to Animal rights and rescue or other charity :)✌️

LTC update#LTC made a good rise in a day that the whole market was in a big drop !
i think this coin has a good potential for a big rise as it has a good fundamental news too
check out the higher time frame pattern

LTC REJECTED Analysis 🚨
CRYPTOCAP:LTC is getting rejected from the resistance zone and is likely to pull back to the blue zone 🔵.
🎯 Next Target: Blue zone (support level)

The fate of Litecoinhello friends
Here we have two scenarios:
1_ Channel failure and reaching specified goals.
2_ Falling from the roof of the channel and buying in steps.
Considering the high probability of approval of Litecoin ETF, the first scenario is more tolerant.
*Trade safely with us*

LTC - Short play I have entered short on LTC as it is now overbought, while in a major downtrend and has reached an hourly resistance.

LTC/USDT Swing ideaI have placed the entry on 4h ifvg which lies nicely in the ote zone making this a nice swing trade. SL at 110.05 and partial profits will be taken along the way.
GL and do not overexpose or overleverage yourself.

LTCUSDT 1H LONGOn higher timeframes, the asset forms many liquidity pools and has aggressive market purchases, thereby protecting the break levels of the structure!
Previously, the asset went under the POI range , but returned on good volume with full-bodied candles.
I am considering a long position at the specified price on a trading chart with targets:
$123.69
$131.20
$141.22
Risk management - 1% on stop order

LiteCoin Lesson 15 said LongThe Methodology:
Location - We are in Fib Ares
Largest down volume wave ( many times we have buyers on large down waves.
To confirm that there are buyers we do the following:
Place AVWAP at the beginning of the down wave, wait for price to cross upwards and finally wait for a Plutus Long Signal --------and up we go!!!!

LTC update#LTC has a special pattern in its chart the market is bullish in low and also high time frames and the pattern it has is different from BTC and other big coins so it can rise while the whole market is going down !

LTC HUGE PROFIT !#LTC made a real big triangle with 5 elliot waves and the price can rise up to 400% when it crosses the confirmation line !
check out the long term analysis on this coin !

LTC analysis (12H)From the point where we placed the red arrow on the chart, it seems that LTC's correction has begun. Due to ETFs, there is a lot of FOMO around this asset, but it's better to analyze it technically.
It appears that LTC is in an ABC correction or a more complex pattern. Currently, it is in wave B, which is forming as a diametric. We can look for buy/long positions in the green zone.
A daily candle closing below the invalidation level will invalidate this analysis.
For risk management, please don't forget stop loss and capital management
Comment if you have any questions
Thank You

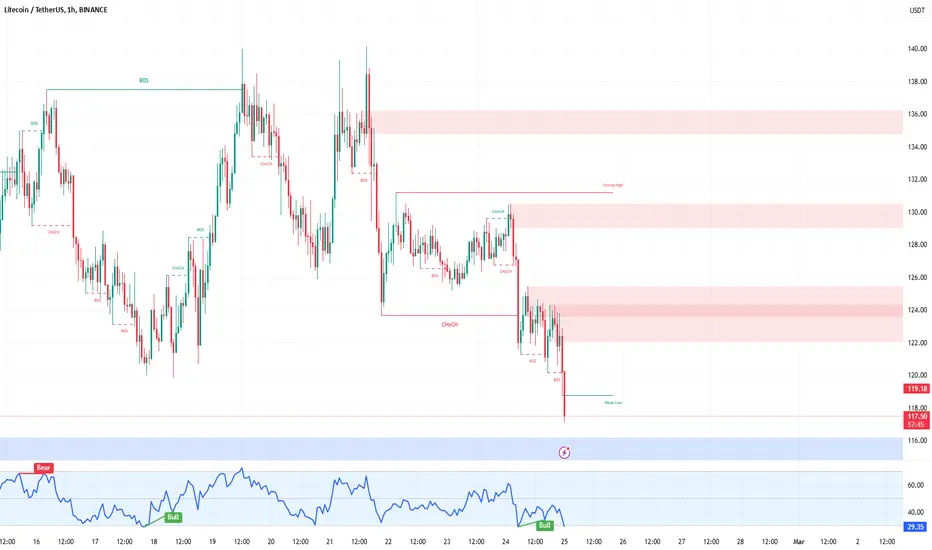
LTC/USDT 1H: Bearish Breakdown – Short Setup Targeting $115.50?LTC/USDT 1H: Bearish Breakdown – Short Setup Targeting $115.50?
🚀 Follow me on TradingView if you respect our charts! 📈 Daily updates!
Current Market Analysis:
Price at $119.85 showing strong bearish momentum.
Market makers appear to be in a distribution phase with clear lower highs.
Hidden bearish divergence on RSI confirms the downtrend.
Risk Score: 8/10 – High risk environment.
Market Maker Activity:
Distribution pattern is evident with lower highs.
Declining volume on bounces suggests persistent selling pressure.
Expect continued downside until testing support around $115.50.
Trade Setup (Confidence 8/10):
Recommendation: Short position with high confidence.
Entry: At current price ($119.85).
Targets:
T1: $118.00
T2: $115.50
Stop Loss: Set at $122.40 (above recent swing high).
Key Resistance Zones: $124.00, $128.50, $136.00
Recommendation:
Wait for confirmation of entry with a rejection around $122. This setup aligns perfectly with SMC principles, indicating strong institutional selling pressure.
🚀 Follow me on TradingView if you respect our charts! 📈 Daily updates!

Litecoin likely heading to $260.. Its one of the few cryptos with a monthly cross happening.. It is because this is one of the original 3 cryptos and it takes this long for some to have a monthly cross which is the most powerful cross possible next to a weekly or daily. So it should be extremely bullish if it breaks out.

LTC/USDTHello everyone, let's look at the 4H LTC chart to USDT, in this situation we can see how the price moves in the local high -ranking channel in which we quickly saw the return to the lower border of the channel. However, let's start by defining goals for the near future the price must face:
T1 = $ 129
T2 = $ 132
Т3 = $ 138
Let's go to Stop-Loss now in case of further declines on the market:
SL1 = $ 125
SL2 = $ 121
SL3 = $ 118
SL4 = $ 114
Looking at the RSI indicator, we see
As we entered the lower part of the range again, which may indicate a new growth movement, but here you can see the city so that any correction deepens.

LTC UpdateThe LTC chart also looks bullish, and I anticipate it reaching the channel's upper boundary. Take a look for yourself!

Litecoin LTC Will Repeat The Same Pattern?Hello, Skyrexians!
Today it's time to update our BINANCE:LTCUSDT idea. It has formed the same pattern like we have seen before 2021 altseason. We know that patterns usually play out in the opposite direction than we saw in the past because of the trader's expectations, but this time we have some proofs that this pattern can play out the same.
Let's take a look at the weekly time frame. First of all we wanna you to notice the green dot on Bullish/Bearish Reversal Bar Indicator at the very bottom. This signal increases probability of a strong bull run until the red dot flashes. We also can count the Elliott waves. Wave 1 was in 2022-2023, and after that wave 2 was tricky flat correction and now price is in wave 3. Wave 3 has the target between 1.61 and 2.61 Fibonacci extension levels. The conservative target is $174, the optimistic is almost $250.
Best regards,
Skyrexio Team
___________________________________________________________
Please, boost this article and subscribe our page if you like analysis!

SPOT LTC LONG 8.01.2025Pinning after abnormal purchases.
🎯Purpose:
133.15
I'll let you know when I record it manually.
‼️Risk per trade: 1% of the allocated funds for spot trading.
Thank you!
