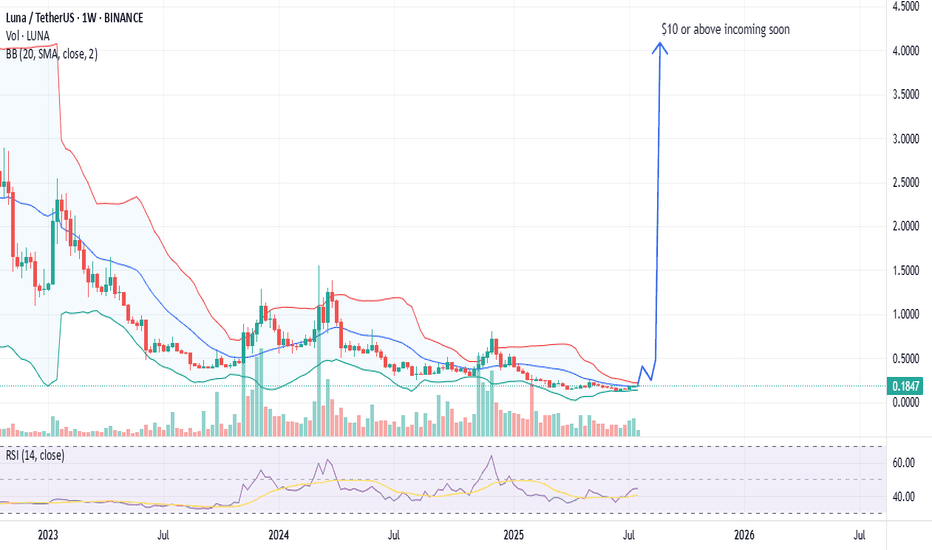
LUNA/USDT crypto trading chart Breakout soon1. Technical Setup Favors Explosive Breakout
Moving Averages (Strong Buy Signal):
7/8 daily EMAs and SMAs (including critical 10-day, 21-day, and 50-day) show bullish alignment, with price trading above key averages. This indicates entrenched upward momentum.
Only the 200-day SMA ($0.23) acts as resistance—a clean break could trigger FOMO buying.
Divergence spotted in all major Indicators
Pattern Breakout: An 8-hour chart descending triangle breakout is noted, with measured move targets at $0.95 (TP1) and $1.30 (TP2) . While short of $10, this signals technical strength.
2. Terra Liquidity Alliance + DEFI Eris Protocol: The $10 Catalyst
The real game-changer isn't on charts yet—it's the flywheel effect of:
Inflation-Driven Rewards: TLA directs LUNA inflation into yield pools. At current prices, this funds $6.2M/year in rewards, but if LUNA hits $3, rewards explode to $62M/year .
Eris Protocol's Amplification:
Users stake LUNA to mint arbLUNA (liquid staking derivative).
arbLUNA enables governance voting + yield farming, generating ~250%+ net APY when combining:
Stablecoin pool rewards (200%+ APY in LUNA).
Governance incentives (50%+ APY for voting).
Strategy: Borrow stablecoins at <5% (e.g., via Mars Protocol), farm in Eris pools, and compound LUNA rewards.
Cross-Chain Capital Influx: Axelar bridges assets (wBTC, wETH) from Ethereum/Cosmos, directing external liquidity into Terra. A $1M Axelar DAO proposal is underway to turbocharge this .
3. Why This Could Fuel a $10 Surge
Demand Shock: To earn 250%+ APY, users must buy and stake LUNA → shrinking circulating supply.
Reflexive Price-Reward Feedback:
LUNA price ↑ → Value of farming rewards ↑ → More users join → LUNA demand ↑.
Example: A LUNA price rise to $1 would increase annual rewards to ~$20M, pulling in massive capital.
Scalability: The model supports $100M+ TVL: Current 24h volume shows liquidity depth, and Axelar integration could 10x inflows.
Short Squeeze Potential: With massive monthly gains already, sustained buying could force shorts (betting on declines) to cover, accelerating upside.
4. Feasibility Timeline: Path to $10
Phase Price Target Timeline Catalysts
1. Breakout $0.50-$1.30 1-2 weeks Triangle breakout, SMA 200 breach
2. Acceleration $3-$5 3-4 weeks TLA TVL hitting $50M+, Axelar DAO funding approval
3. Parabolic $10+ 6-8 weeks Reflexive APY >300%, exchange FOMO listings
Conclusion: A High-Probability moonshot
While $10 seems audacious, the Terra-Eris flywheel creates unprecedented buy pressure. Technicals confirm bullish momentum, and the 250%+ yield mechanism could attract billions in capital within weeks. $3 is a near-guarantee if TLA TVL doubles; $10 becomes viable if LUNA's market cap climbs toward top 50 coins. Watch for these triggers:
Axelar DAO approving TLA funding.
LUNA holding above $0.23 on weekly close.
Rising stablecoin deposits in Eris pools
LUNA2USDT trade ideas
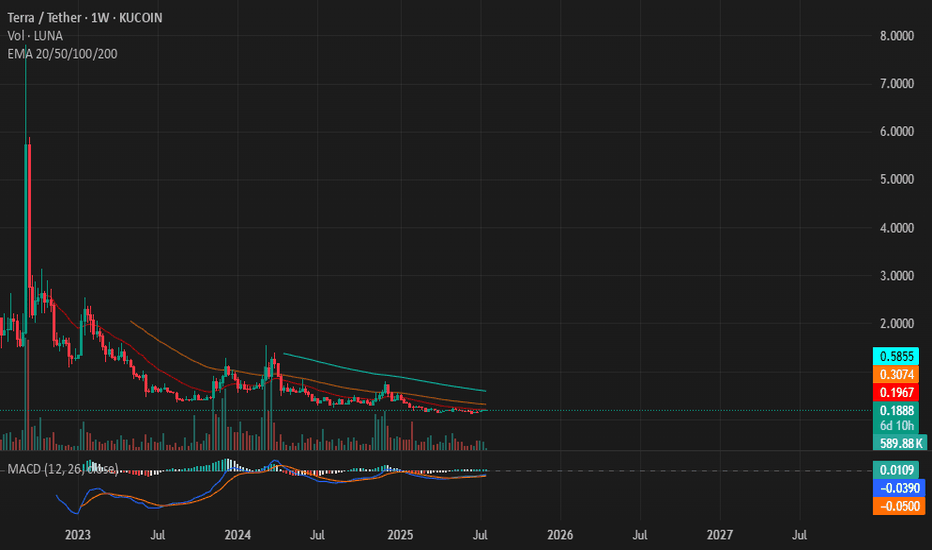
LUNA terra liquidity alliance erisprotocol APR Breakout soonLUNA has been consolidated for a while. LUNA 1 week trading chart is showing a massive bull pattern, which could trigger at any moment. EMA 20, 50, 100, and 200 are hinting at signals for a massive breakout in the coming weeks or much sooner.
Hundreds more dapps and many services are in the pipeline; expect their release next month which would lay the foundation for LUNA to return to its throne where it left.
The Terra Liquidity Alliance Eris Protocol is a game changer for Luna 2.0. In this, staking rewards are diverted to liquidity alliance, which incentivizes the liquidity providers to deploy liquidity on alliance and earn massive APR.
The LUNA on-chain liquidity is on the rise, which is generating volume and slowly adding buy pressure on LUNA 2.0. As the LUNA price rises in value, the reward value will increase automatically. Which will significantly increase APR and incentivize liquidity providers more.
This is an infinite positive loop that will start soon in the coming weeks.
The 0-day un-bonding time period by liquidity alliance Eris Protocol will shape the DeFi future soon. With massive 200%+ APR, anyone can borrow at less than 12% from any DeFi ecosystem, build some nice DeFi strategies, and reap maximum benefits from it.
#LUNA Extended ! lONG Term#LUNA
The price is moving within a descending channel on the 1-hour frame, adhering well to it, and is heading for a strong breakout and retest.
We have a bounce from the lower boundary of the descending channel. This support is at 0.1480.
We have a downtrend on the RSI indicator that is about to be broken and retested, supporting the upside.
There is a major support area in green at 0.1430, which represents a strong basis for the upside.
Don't forget a simple thing: ease and capital.
When you reach the first target, save some money and then change your stop-loss order to an entry order.
For inquiries, please leave a comment.
We have a trend to hold above the 100 Moving Average.
Entry price: 0.1493
First target: 0.1532
Second target: 0.1565
Third target: 0.1608
Don't forget a simple thing: ease and capital.
When you reach the first target, save some money and then change your stop-loss order to an entry order.
For inquiries, please leave a comment.
Thank you.
#LUNA/USDT#LUNA
The price is moving within a descending channel on the 1-hour frame, adhering well to it, and is heading for a strong breakout and retest.
We are seeing a bounce from the lower boundary of the descending channel, which is support at 0.1780.
We have a downtrend on the RSI indicator that is about to be broken and retested, supporting the upward trend.
We are looking for stability above the 100 moving average.
Entry price: 0.1860
First target: 0.1900
Second target: 0.1950
Third target: 0.2020
Terra Luna Bottom & Bullish Reversal (444% Profits Potential)We know for a fact that the main low of the correction happened 3-Feb., this is shown here with a red candle with a long lower wick. The lower lows after is a continuation of this move.
As soon as price action moves back above this low, we can say that the bulls are in, but this is not all for Terra, LUNAUSDT.
First, we have the candlestick pattern three white soldiers, three consecutive strong green sessions on the daily timeframe. This signal can be followed by a retrace that ends in a higher low followed by additional growth.
This signal is supported by rising volume. Volume is rising slowly each day and the third and last day has the highest volume in weeks. Of course, the downtrend has also been broken.
Finally, the action is happening above EMA55 and today above EMA89. So the long-term bullish bias and growth potential is being activated.
There is a more, the RSI is really strong and MACD on the bullish zone (not shown). All these are classic signals revealing that Terra Luna is set to experience long-term growth.
The correction is over.
The bottom is in.
Crypto is going up.
Namaste.
Breaking: Terraform Labs' claims portal opens on March 31, 2025Terraform Labs is set to open its claims portal for crypto creditors on March 31, 2025, allowing individuals impacted by its bankruptcy to submit claims. The portal will help those who suffered losses due to the collapse of TerraUSD and other cryptocurrencies related to Terraform Labs’ operations.
As part of the bankruptcy proceedings, the company is working to reimburse its creditors, with a deadline for Terraform Labs claims submission set for April 30, 2025.
Terraform Labs Claims Portal Opening Date and Deadline
According to TerraForm Labs, the claims portal will be accessible at claims.terra.money on March 31, 2025. Creditors who would wish to submit a claim should do so before the 30th of April in the year 2025, at 11:59 PM Eastern Time.
Any claims submitted after this date will not be considered and those involved will lose such an opportunity to recover. In filing the claim, the creditors will have to give an identification of their cryptocurrency assets comprising of wallet addresses, or read-only API key among others.
Technical Outlook
Despite the strategic development, the price of VIE:LUNA seems unbothered. The asset is down 10.39% as of the time of writing. Trading within a bearish engulfing pattern with the RSI at 29 hinting at a possible reversal as the asset is long oversold.
Should VIE:LUNA break above the 38.2% Fibonacci level, a trend reversal will be inevitable.
Terra Price Live Data
The live Terra price today is $0.189004 USD with a 24-hour trading volume of $18,694,216 USD. Terra is down 10.68% in the last 24 hours. The current CoinMarketCap ranking is #268, with a live market cap of $134,190,185 USD. It has a circulating supply of 709,984,439 LUNA coins and the max. supply is not available.
LUNAUSDT UPDATELUNAUSDT is a cryptocurrency trading at $0.1946. Its target price is $0.3500, indicating a potential 85%+ gain. The pattern is a Bullish Falling Wedge, a reversal pattern signaling a trend change. This pattern suggests the downward trend may be ending. A breakout from the wedge could lead to a strong upward move. The Bullish Falling Wedge is a positive signal, indicating a potential price surge. Investors are optimistic about LUNAUSDT's future performance. The current price may be a buying opportunity. Reaching the target price would result in significant returns. LUNAUSDT is poised for a potential breakout and substantial gains.
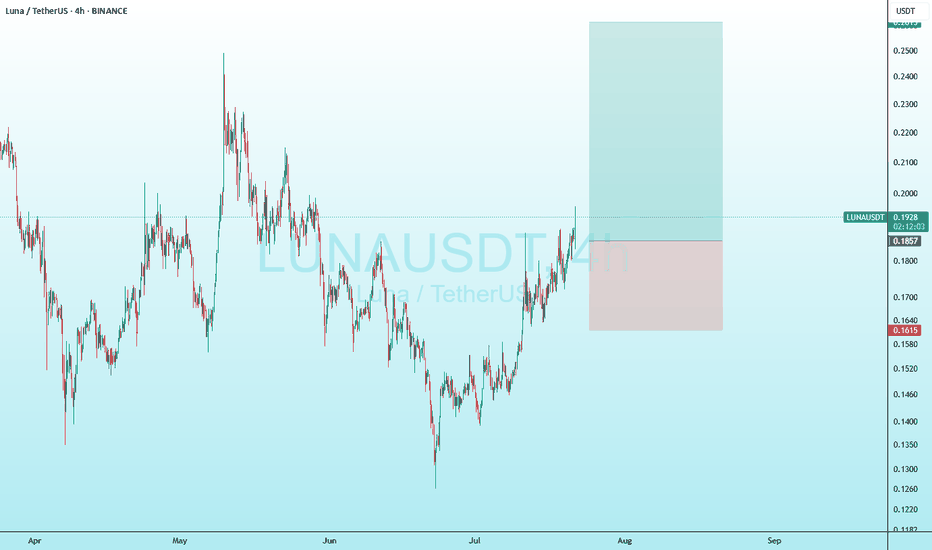
LUNA USDT SHORT TERM ANALYSISAccording to the market trend LUNA looks oversold here and can perform good in short term
Green Box is the best buying zone i had shown in the graph
1st target for this is 1$
2nd Target for LUNA is 2.5$
and also 2.5$ mark is a huge selling area, Couple of weekly candles closing above 2.5$ can confirm a Long term upward momentum, After successfully buying over 2.5$ area can trigger price to 6.4$ mark OR even more
OBVIOUSLY A ULTRA HIGH RISK IDEA - LUNA !IT SOUNDS CRAZY, BUT I EXPECT A LUNA PUMP IN 2025
If you look at the technical part of the Luna coin chart, you can see 2 features
1. The price has been in a typical pump phase of accumulation since August 2023, each time receiving a buyer's reaction in the support zone at 0.321
2. In terms of volume, I would say that this is one of the mega divergences, as the price is in a range with a constantly growing volume of purchases, which will sooner or later be realized with the price increase.
No call to buy the relaunched scam, but this coin is definitely worth a look from a technical standpoint
$LUNAUSDT Chart Say Finally Target Hit Resistance FVG area see oBINANCE:LUNAUSDT Chart Say Finally Target Hit Resistance FVG area see on chart...
Wait for Double FVG touching area
Disclaimer: Digital asset prices are subject to high market risk and price volatility. The value of your investment may go down or up, and you may not get back the amount invested. You are solely responsible for your investment decisions and Binance is not available for any losses you may incur. Past performance is not a reliable predictor of future performance. You should only invest in products you are familiar with and where you understand the risks. You should carefully consider your investment experience, financial situation, investment objectives and risk tolerance and consult an independent financial adviser prior to making any investment.
Luna ($LUNAUSDT): 8-Hour Analysis for Strategic Trade SetupI spend time researching and finding the best entries and setups, so make sure to boost and follow for more.
Luna ( BINANCE:LUNAUSDT ): 8-Hour Chart Analysis for Strategic Trade Setup
Trade Setup:
- Entry Price: $0.5451
- Stop-Loss: $0.3728
- Take-Profit Targets:
- TP1: $0.9479
- TP2: $1.3018
Fundamental Analysis:
Luna ( BINANCE:LUNAUSDT ) continues to be a significant player in the DeFi ecosystem despite its historical challenges. The network's commitment to rebuilding its ecosystem and expanding partnerships has drawn attention back to the token. The recent upgrades to its Terra blockchain aim to enhance scalability and adoption among developers.
Technical Analysis (8-Hour Chart):
- Current Price: $0.5525
- Moving Averages:
- 50-EMA: $0.5000
- 200-EMA: $0.4800
- Relative Strength Index (RSI): Currently at 60, indicating growing bullish momentum.
- Support and Resistance Levels:
- Immediate Support: $0.5000
- Resistance: $0.6000
The 8-hour chart reveals a breakout from a descending triangle pattern, signalling potential for a strong upward movement. The take-profit targets align with Fibonacci extensions, providing logical levels for scaling out of the position.
Market Sentiment:
LUNA has seen increasing trading volumes, reflecting renewed interest in the project. Recent announcements around ecosystem developments and strategic partnerships have boosted confidence among traders.
Risk Management:
A stop-loss at $0.3728 ensures limited downside risk, while TP1 and TP2 offer impressive reward potentials of approximately 73% and 139%, respectively. Discipline in executing this trade is crucial, given the token's volatility.
Key Takeaways:
- LUNA’s breakout signals a potential bullish continuation.
- Strong risk-to-reward ratio for both scalpers and swing traders.
- Strict adherence to stop-loss and target levels is necessary.
When the Market’s Call, We Stand Tall. Bull or Bear, We’ll Brave It All!
*Disclaimer: This analysis is for informational purposes only and does not constitute financial advice. Traders should conduct their own due diligence before making investment decisions.*
Is #LUNA on Brink of a Major Breakout? Watch These Key LevelsYello, Paradisers! Could #LUNA’s next big move be just around the corner or the momentum will fade? Let's discuss the #Terra's latest analysis:
💎Currently, #LUNAUSDT is holding its ground at the critical demand zone of $0.313, showing signs of a bullish continuation. Positioned within a Descending Broadening Wedge pattern, #LUNA looks ready to challenge the descending resistance line—a potential turning point that either confirms strength or suggests further caution.
💎Volume has remained robust, and with #LUNAUSDT recently marking an all-time low, we may be witnessing the start of a significant rebound. It’s often said, "Once we hit bottom, the only place to go is up," and this moment could be setting up for just that kind of breakout.
💎If #LUNA can maintain its position, we could be on the edge of a substantial rally. A move above the $0.514 minor resistance zone would open the path to higher targets and possibly even new highs.
💎However, the current level is crucial. If momentum weakens, there’s a chance we’ll see a pullback toward the major support area between $0.247 and $0.267. A daily close below this zone would undermine our bullish outlook and indicate the risk of further downside.
Stay vigilant, Paradisers, and closely monitor #LUNA's price action.
MyCryptoParadise
iFeel the success🌴
$LUNA above price $0.67 and its FVG Resistance area. See chartBINANCE:LUNAUSDT above price $0.67 and its FVG Resistance area. It will touch price $0.77 and it will touch $1 before consolidation of Big FVG price level area.
Disclaimer: Digital asset prices are subject to high market risk and price volatility. The value of your investment may go down or up, and you may not get back the amount invested. You are solely responsible for your investment decisions and Binance is not available for any losses you may incur. Past performance is not a reliable predictor of future performance. You should only invest in products you are familiar with and where you understand the risks. You should carefully consider your investment experience, financial situation, investment objectives and risk tolerance and consult an independent financial adviser prior to making any investment.
Terra Luna (LUNAUSDT) Opens 2,000% Bullish-Growth PotentialIt is the first time ever that LUNAUSDT (Terra) closes four consecutive weeks green. This is happening after an ATL in August.
Can we say bullish consolidation?
Consolidation as prices slowly climb higher... Absolutely.
This is unusual and unusual is good. Since the market was bearish since 2022, seeing a change of behavior, unusual price patterns, can mean that price dynamics are about to change. Change from bearish to bullish of course.
Whale accumulation has been happening since August 2023. I can tell by noticing how buy volume is always higher than sell volume on most of the candles. It means that more money is exchanging hands when prices are going up rather than down.
Now, this is not just any pair, growth potential goes as high as 2,000%. Even 3,265% is possible if LUNAUSDT hits $19, for this, we have to wait and see.
Thank you for reading.
Namaste.
#LUNA/USDT#LUNA
The price is moving in an ascending channel on the 1-day frame and is sticking to it very well and is about to break upwards
We have a bounce from the lower limit of the channel at 0.3000
We have an ascending trend on the RSI indicator that is about to break, which supports the rise
We have a trend to stabilize above the 100 moving average
Entry price 0.3857
First target 0.4655
Second target 0.5394
Third target 0.6451


