LUNAUSDT trade ideas

Will LUNA recover? Hello everyone,
LUNA is currently sitting in a awkward position, nobody was expecting to see LUNA this keep ever again however it happened and it had a tragic impact over the market as well.
I believe LUNA is going to recover and go back to $58 dollars in the next days.
Be patiance and don't let your feeling influence your decisions.
Have a good trading week.

Lunatics spouting nonsenseLuna possibly going to $150 on an inverse head & shoulders.
Probably nothing...

LUNAUSDTHello Crypto Lovers,
Mars Signals team wishes you high profits.
This is a one-day-time frame analysis for LUNAUSDT
You are observing a heavy fall for the price after it lost its support. At the present, it is approaching the first support line and we believe it will have a fluctuation at this area. Then we expect a rise for the price.
Warning: This is just a suggestion and we do not guarantee profits. We advise you analyze the chart before opening any position.
Wish you luck


Huge profit?Fastened your seat belt we are going to the moon. 🖤🖤
The heavy we fall, the greater we rise 🤩🤩
Expected target
ENTRY : 24 - 30.20
(OTE: 26.77)
🔘Target 1 - 31
🔘Target 2 - 32.20
🔘Target 3 - 34
🔘Target 4 - 36
🔘Target 5 - 43
🔘Target 6 - 58
🔘Target 7 - 82
🔘Target 8 - 110
🔘Target 9 - 148
🚫STOP LOSS: 20.32
RISK: Medium
Dyor, im not responsible for any lost,


#LUNA / $LUNALuna bouncing on support zone, as the price drop more than 50% yesterday.
It have to bounce from here!!!


LUNA SHORTwell, that was a fun one
insane short on $LUNA
so many people would not believe this scenario and now that it is, there's nothing they can do but to accept it

Luna Luna, when r u gonna be stable? Looks like its gonna be 6?Luna Luna, what big bear divergence with you
What big withdrawal from Anchor we see
What big defence you put
The tide has turn
Gravity has shifted
See you at 6...Be stable... Be calm ya...
NFA DYOR

WILL THIS ASCENDING TRENDLINE CONTINUE TO HOLD?Luna sitting on a very long trendline. The question is if this ASCENDING TRENDLINE will hold LUNA up?
Or will the BEARS break this point like they did before and allow the fall in price to continue?
Share your thought and views

LUNA-USDT Long TermBINANCE:LUNAUSDT
Long Term Analys - Not a financial advice
Resistance Levels 104 - 120 - 135
Support Levels 9 - 25 - 38 - 44

LUNAUSDT Gartley FormationThe Gartley Pattern is one of the most traded harmonic patterns and can be applied to many markets and timeframes. It is a 5-point retracement structure that was originally outlined by H.M. Gartley and detailed further by Scott Carney. It has specific Fibonacci measurements for each point within its structure and it is important to note that D is not a point, but rather a zone in which price is likely to reverse, called the Potential Reversal Zone (PRZ). The B point retracement of the primary XA leg lies at 0.618 and the PRZ consists of 3 converging harmonic levels: 1) 0.786 retracement of the primary XA leg, 2) AB=CD pattern and 3) the BC projection is either 1.27 or 1.618.
The first target would be the 382 retracement of AD and the second target the 618 retracement of AD. A common stop level would be behind the X-point. Conservative traders may look for additional confirmation. Gartley Patterns can be bearish and bullish. TradingView has a smart XABCD Pattern drawing tool that allows users to visually identify 5-point reversal structures on a chart.

LUNA - Time to Rebound?Epic crash... Luna around 30% lower.
Regardless, every dip might be an opportunity to buy and our chart shows LUNA at major support..so we are Buying.
Previously, our Luna charts had worked well (in some occasions) :
LUNA is a project that stands out. Today is a reality check for everyone.
We are Long on LUNA now.
One Love,
the FXPROFESSOR
(WE USE STOP LOSSES..AT THIS CASE WE HAVE OURS AT 42$) - DYOR, Risk your own time and money

this sh**t coin worth less than 1 $sell without stop loss! just do money management! all indicators show huge fall, take care of your money

Luna ShortLuna Signal
Buy at 53 53.5 54$
Take profits: 50 45 40 38
Stop loss 60
10x
Please like and Support me

LUNA BEST FAKEOUT I HAVE EVER SEEN PERSONALLYLUNA H & S target almost hit, also making a LL on the DTF.
I would expect a bounce from approximately $45-50.
If we lose this support then my Diamond Top pattern was successful and LUNA could collapse to $28, $20, $16. It could also be one of the best fake outs I have ever seen.
SOMETHING else that I spotted was BTC dumped in November, then LUNA went on a pump to make a HH.
LUNA VS BTC they are definitely correlated like BTC V DXY used to be.
I think LUNA will pump based on my charts when BTC finds a bottom or consolidation.
Very strange how it is suppose to be a stable coin for BITCOIN.
Will LUNA pump like it previously did? Time will tell.
NOT FINANCIAL ADVICE!

LUNA LongHey traders, in this week we are monitoring LUNA for a buying opportunity around 58 zone, once we will receive any bullish confirmation the trade will be executed.
Trade safe, Joe.

analysis of Luna and review of support points new versionComplete analysis of Luna currency and review of support points part 2
we got +100% tp in old version
here we have breakdown bear will take profit in 50 and 45 or 42 and we can buy in 45 or 50 or 47.500 42 its very good to spot trade
The points marked with green lines are suitable for adding this currency to the portfolio and we can maintain it in the long or medium term and make a profit.
note:All the projects to buy and add to the portfolio are also in my portfolio too...

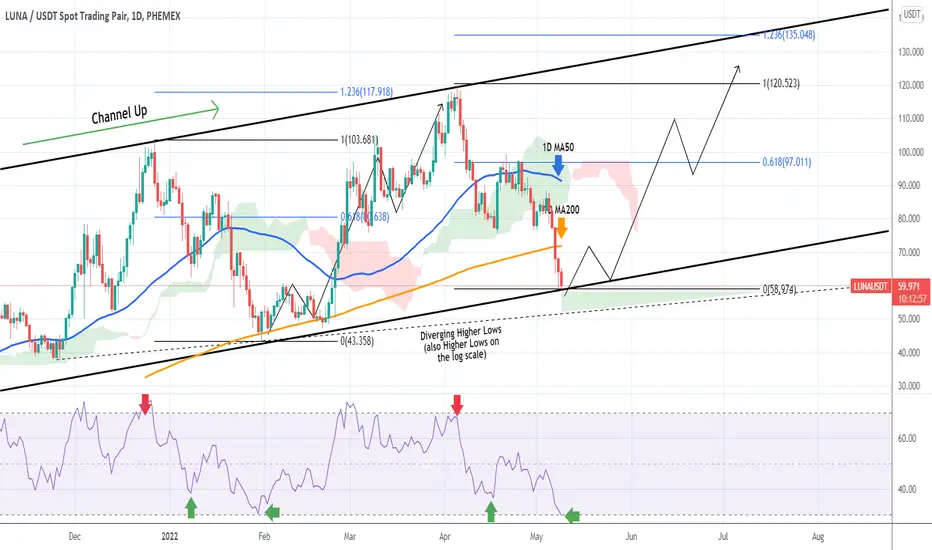
LUNAUSDT Hit the bottom of its 6 month Channel Up*** ***
For this particular analysis on TERRA we are using the LUNAUSDT symbol on the Phemex exchange.
*** ***
The idea is on the 1D chart with the blue trend-line being the 1D MA50 and the orange trend-line the 1D MA200. As shown, LUNAUSD has been trading within a Channel Up ever since its December 2021 High. Two Higher Lows and another Higher High have followed, forming the bullish trend on this Channel.
Today the price hit the Higher Lows trend-line (bottom) of this long-term Channel Up on the liner scale. On the log scale, there is still some room for a complete pull-back, which happens to be on this diverging Higher Lows trend-line as illustrated on the chart. The RSI (1D) is exactly on the level (oversold 30.000) where the last Higher Low was priced on January 30 2022. If those Support levels hold, we expect LUNA to gradually start the new rally to a Higher High within the Channel Up.
Attention is needed, as this time besides the 1D MA50, it also has the 1D MA200 as a Resistance on the short-term. Potential confirmation comes if the price breaks above it. The 0.618 Fibonacci retracement level ($97.000) can be used as a medium-term target with the 1.236 ($135.000) being the long-term (which priced the previous Higher High).
--------------------------------------------------------------------------------------------------------
** Please support this idea with your likes and comments, it is the best way to keep it relevant and support me. **
--------------------------------------------------------------------------------------------------------
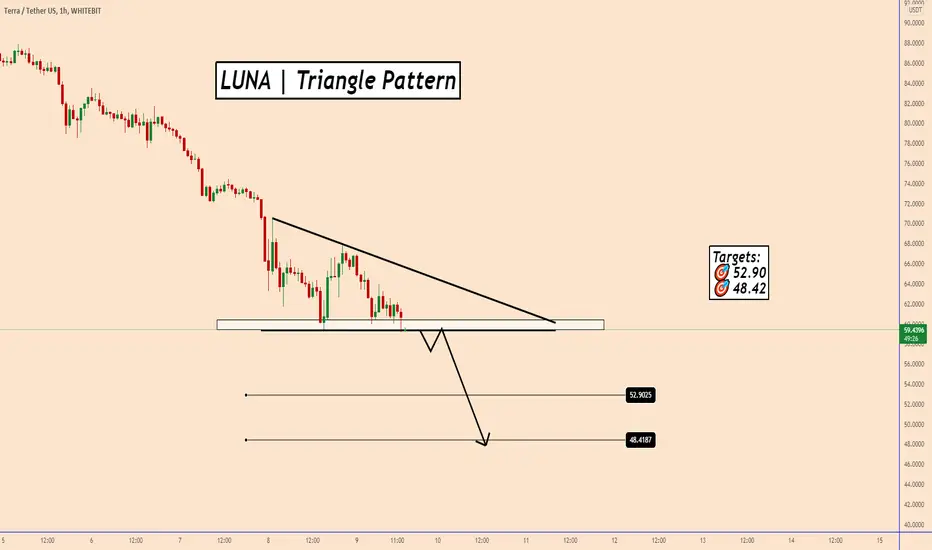
LUNA | Triangle Pattern | SELLLUNA | Triangle Pattern
The price is creating a triangle pattern on Luna's chart.
The bearish momentum on BTC and the actual panic that is spreading in
the market is moving everything down.
Altcoins are suffering more than the others as it seems.
A breakdown of the price below the triangle would increase the chances for more downside as below:
Targets:
🎯 52.90
🎯 48.42
Thank you and Good Luck!