LuncClassic Time daily is on a good resistance...and you can do growth, you can monitor The specified path is the probability
LUNCUSDT trade ideas

LUNC FROM A SHORT AND MEDIUM TERMHello Traders and everyone, I am Hadi Karaali, Known as SNIPERS_FX
If you like the idea, do not forget to support with a like and follow.
LUNC QUICK UPDATE
As we clearly see price is still overall bearish trading inside this channel making clean lower lows and lower highs.
However, price is now sitting around a strong support zone, where we will be looking for new longs.
And for the bulls to kick in we need a break above the first neckline from a short-term perspective.
And for the bulls to kick in from a medium term we need a break above the upper major swing high, then a further movement higher would be expected.
Until that happens price is bearish, and price can still trade lower before reversal.
If you like this kind of analysis don't forget to like and follow
and as usual follow your trading plan and manage your risk.
Be patient and good luck!


LuncUsdt Long The price failed to break below and I now expect a reversal higher. Look to open a long position where possible.


Soon there will happen something! With this price action something is settled up.. lets us hope we soon see a higher high, and some Momentum to the upside..
Let's go!

LUNC SHORT AND MEDIUM TERM!Hello Traders and everyone, I am Hadi Karaali, Known as SNIPERS_FX
If you like the idea, do not forget to support with a like and follow.
LUNC QUICK UPDATE
As we clearly see price is still overall bearish trading inside this channel making clean lower lows and lower highs.
However, price is now sitting around a strong support zone, where we will be looking for new longs.
And for the bulls to kick in we need a break above the first neckline from a short-term perspective.
And a break above the upper major swing high from a medium term perspective, bear in mind price can still pull back due to the falling trendline, so we need a break above the trendline as well.
Until that happens price is bearish and price can still trade lower before reversal.
If you like this kind of analysis don't forget to like and follow
and as usual follow your trading plan and manage your risk.
Be patient and good luck!

#18 TA only.More information about this idea, is to be found in idea '#17 TA only.'
Lets see what happens!

#17 TA only.What I think will happen:
Summary: Check the Text Boxes in the chart and the Big Green Arrow.
You can always take profit earlier/lower (before my targets are reached).
Just set your own targets, because 500-700%+ is alote of gain imo, take profit along the way (which you can use the ' Fib Speed Resistance fan/map for ' (only if you trust it lol).
Caution No 1. Be careful buying here, as we could get one more downturn here, so ' Pay Close Attention ' to the price between the ' Two Horizontal Orange Lines ', to protect as much capital as possible.
CAUTION No 2. Near my targets (if they even get reached lol), you want to be careful, because you probably dont want to be left holding a sh--coin.
I expect it to crash real hard again like last time, hopefully after it reaches my targets, but the same (crash) I see happening for BTC starting this year, until next year.
Lastly: This financial advice was brought to you by an 'unlicensed financial advisor' (I can totally be wrong, don't take my analysis too seriously).
Lets see what happens!

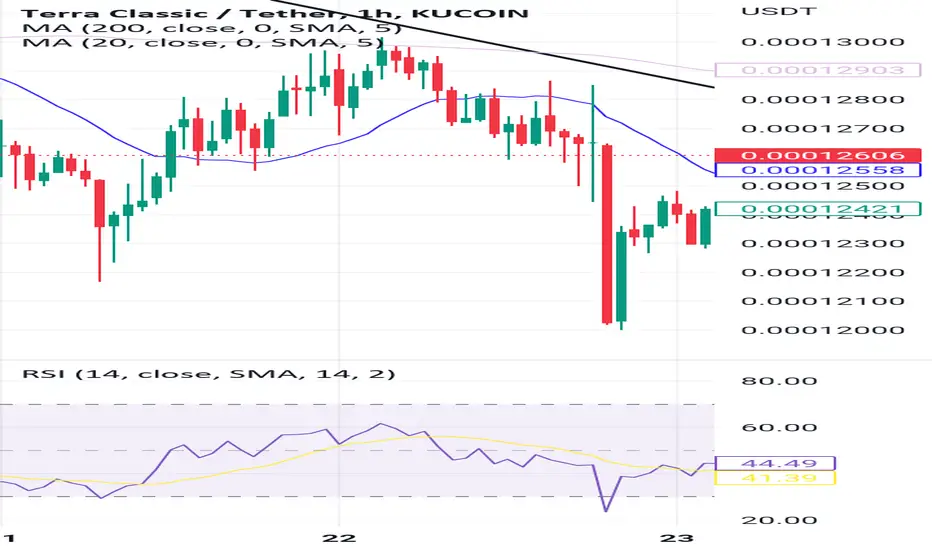
Formation of Bullish Butterfly Harmonic Pattern on LUNCUSDT 1 HrDear Tradingview family,
Symbol: #LUNC_USDT
Strategy: #Harmonic_Chart_Patterns, #Butterfly_Pattern, #Trend_Reversal #Trendline #Support_Resistance #RSI_Bullish_Divergence.
Trade Call Type: #LONG.
Order Type: Buy Stop
Indicators: #Price_Action. #Chart_patterns, #Butterfly_Pattern, #Trendline #Support_Resistance #RSI_Bullish_Divergence. #RSI #RichTL
Entry: LONG when price breaks Previous Higher High .
Anchor Time: 4 Hours
Trading Time Frame: 1 Hours.
Entry price: 0.00012336
Take Profit: 0.00012842
Stop Loss: 0.00011831
RRR- 1:1
Methodology:
As a professional and experienced forex, crypto and stocks trader, I will be using a rigorous methodology that involves analyzing the price action and key levels and using a combination of indicators, harmonic chart patterns and chart patterns. I will be looking for potential trendlines , support & resistance levels where the price action may reverse and using our indicators to confirm the validity of our analysis. Based on my analysis, I will then determine the optimal entry and exit points for our trade, as well as the appropriate stop loss level to manage risk.
Analysis:
The current price action on the #LUNC_USDT chart is showing a clear Breakout of #Butterfly_Pattern, on 4 & 1 hourly timeframes. Additionally, the Bullish RSI divergence on 1 Hour time frame add value to the strength of reversal pattern.
Price action’s this move provides me opportunity to earn some profits on when it is providing a great value of RRR of 1:1.
My Buy Stop entry is planned to execute when price action breaks the previous Higher High.
Conclusion:
Based on our analysis, I believe that there is a potential trading opportunity for a LONG trade.
Risk Assessment:
Conservative Traders risk 0.5% to 1.5%, moderator traders risk 1.6% to 3.5% and aggressive traders risk 3.6% to 5% of their account per trade.
Please use Position size calculator to calculate your risk per trade.
Overall, I believe this setup has a good chance of success based on the technical analysis , but as always, it's important to monitor the price action closely and adjust the trade if necessary based on new information.

Terra or Terror Classic? Weekly BoxTerra Classic
(LUNC)
Date: 4/3/23
If we bounce on the red Line(s)
Bullish Targets:
(1) .00015000 (23%)
(2) .00015800
(3) .00016500
(4) .00017600
(5) .00018000
(6) .00021000 (71%)
If we bounce out of the box, just sell! It's not going to be good.
Retest .00004 possibly (-60%)

LUNCUSDT 30M**LUNCUSDT 30M**
> ***Setup:***
> Type: Long
>
> Entry: 0.00012400
> Target: 0.00013000
> Stop: 0.00012000
>
> Risk: High
> Estimated Profit: 4.84%
> Estimated Loss: 3.23%

Luna Classic in 4-HourLuna Classic Broke is supported by support in yelllow trend line.
It also broke and re tested white trendline..
Confirming breakout and more upside movement..
Target will be 0.00015

BUY THE DIP FOR LUNC #LUNCBuy the dip for lunc. It seems that is, PO3 is going to work on LUNC. For while there was no movement on LUNC

LUNC Long OpporunityBased off BTC Dominance hitting this resistance zone yet again, if history repeats it self at all we should see alts make a move, specifically LUNC as we can see it liked running in this area last time aswell. Lots of bank Fud and BTC breaking 28k Is very bullish and could be a fantastic long opportunity.

LuncUsdt ShortThis pair has started losing momentum and can't seem to go higher,,try shorting the pair.
*** be wary of high impact news coming out soon
LUNC holds above last line of support 🌶👀bulls are holding the line, still in consolidation faze but pump to .00015-.0002 is still possible short term..
boost and follow for more, will share some updates on smaller time frames.. 💛

Long term Luna Price PredictionLuna lost the support of the descending triangle and it could be headed to much lower prices. Here is my bullish / bearish scenarios.


LUNC - StructureTaget looks like 0.00025 to 0.0003 stretch by mid March.
Not expecting a break below 0.00016 but safest entry would be on retest end of Feb before major move up
Best, Hard Forky

LuncUsdt Longluna is currently consolidating above the 30 MA and it broke above the trend line and came back to touch it from above. Sentiment in the market is positive.
