LuncusdtLunc is about to explode. Developers are about to release something huge. Not financial advice
LUNCUSDT trade ideas

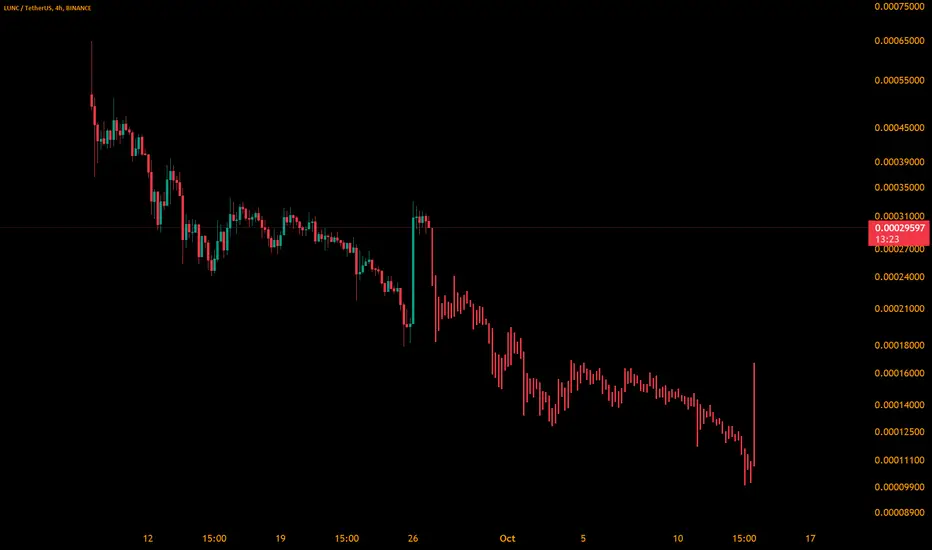
LUNCusdt TrumpsMarketHack Yolo CallGood morning everyone,
We have seen amazing price action in the market and now we have a signal to buy with all our power! I am longing with 20x
Take profit is .000018566
Stop loss is ,000017866
Remember that I am always in tradingview chat if you have ay questions!
I also have tradecopy if anyone is interested!

common sensemight not play out exactly as the chart shows. Its a pump and dump so don't get no bullish ideas of anything more than what it is.
Your choices have consequences so don't complain if you make poor judgements.
$LUNCUSDT UPDATE!!!Hi Snipers,
Please refer to the recording for the next price levels and scenarios.
Thanks
MS

LUNCUSDT Long scalphey traders
look at the chart and check the lvls
what u think about luna classic ?
share ur chart and leave a comment

A little growth but a lot of sheddingThis currency is in a downward trend, it will probably grow up to the ceiling of the channel and after that it will fall more
Therefore, the possibility of falling is stronger.
.
We will be happy if you ask questions and like

Bull PennantBiggest bull pennant yet, falling volume falling price just like the previous 2 times before it pumped. Each time the RSI was in an oversold position, just like it is now. Wait for a breakout and its likely price will continue higher, at least that's what we can assume.

Wyckoff Distribution?This is what I believe LUNC could be in. I was looking at this idea yesterday and didn't think too much of it and now it makes 100% sense LUNC may be in Wyckoff Distribution at the top and broke its AR low and created a SOW. The next step could POTENTIALLY be an Upthrust (UT) above the Buying Climax (BC) high. But we do not know for sure so we must observe this idea to see if the schematic fills out more to make a more likely decision to know where price could go.

LUNCUSDT The next 1D MA50 break can deliver a massive rally!*** ***
For this particular analysis on Terra Luna Classic we are using the LUNCUSDT symbol on the OKX exchange.
*** ***
The idea is on the 1D time-frame where LUNC is on a small pull-back after being rejected on the 1D MA50 (blue trend-line). With the 1D RSI mostly ranged within 55.00 - 35.00, the price action seems neutral. However this resembles the previous sequences of mid August and mid June, which both broke upwards and delivered significant rallies.
The trigger for August was closing above the 1D MA50. As a result, the next time this happens, we may see a massive rally on LUNCUSDT , targeting the Higher Highs trend-line.
-------------------------------------------------------------------------------
** Please LIKE 👍, SUBSCRIBE ✅, SHARE 🙌 and COMMENT ✍ if you enjoy this idea! Also share your ideas and charts in the comments section below! This is best way to keep it relevant, support me, keep the content here free and allow the idea to reach as many people as possible. **
-------------------------------------------------------------------------------
You may also TELL ME 🙋♀️🙋♂️ in the comments section which symbol you want me to analyze next and on which time-frame. The one with the most posts will be published tomorrow! 👏🎁
-------------------------------------------------------------------------------
👇 👇 👇 👇 👇 👇
💸💸💸💸💸💸
👇 👇 👇 👇 👇 👇

LUNCUSDT Updatehey traders
look at the chart
theres 3 lvl with math in this chart ( red - blue - yellow )
all of them aim for demand zone ) Green zone )
what u think ?
share ur chart and leave a comment

LUNCUSDT just finished the bottom bounce Launch TimeLUNCUSDT just finished the bottom bounce. Typically a move from distribution into accumulation looks like a drop that consolidates then bounces and consolidates higher than its baseline....(which is the push down in the middle of consolidation prior to distribution) Then after consolidation high it drops again to manipulate under the baseline to break stop losses and absorb more of the float. Then a move back to the high after the absorption which is shown on chart with Volume stating over the last 6 candles there was 38billion in volume....on the last candle there was 34 billion by its self. this is a signal of absorption is complete and now it consolidates high again just below the area it couldnt pass before. Then when its ready to break through it will drop back down to break the line it created moving up which everyone thinks is safe to place their stop losses... It breaks this line to absorb the last remaining part of the float it needs to break through the area it has not been able to get through.
The reason its been in this area so long is because it has been doing this pattern on every time line and its been waiting for each one to complete this move. Now that we are at this point it can start its move for profits..... Lets hope it takes just as long on this stage as it did on the previous.... smh
by iCantw84it
10.31.22

LUNAC Breakout Structures This is the hourly chart for Luna Classic
Price briefly dips below the horizontal support just to rise up form a flag and continue a large run
This has been seen in the earlier green rectangle and can be seen to be dipping below the horizontal in the current green rectangle
Very Bullish
I believe we are in a disbelief phase for cryptocurrency.

LUNC GO TO HELLFor Luna Classic, the final expectation is that it will reach the green DEMAND zone with time correction

update on Lunc Lunc now in profit release phase, but still in the consolation area and needs to break high.

LUNC TARGET PRICE $40 - $70As We all Know Price is after Two Things
1. Old Highs and lows
2. Liquidity
(Now look there is a very huge imbalance on the market place.
Trading plan
(Buy at lower price and Trade the refill)
(Not an investment idea)

LUNCUSDT | Time for Wave 5?Back in August 2022 the local .786 Fib retracement level proved to be an important one, as LUNC bounced significantly higher. Now, LUNC has reached another local .786 retracement level. Could it pivot upward here to complete what might be the possible 5th wave in an Elliott impulse?
Will be watching closely and trading appropriately.
Please do your own research. This idea is not to be considered financial advice. May YeHoVaH bless you.

Phase C update on the original accumulation idea It's been a long time coming and I believe we are finally in Phase C. We have hit the bottom of the range, sprung, and we back tested the spring as support. Those are all the markings of Phase C. Next it's time for the composite operator to start a new up trend.

LUNC bulls trying to hold the line! 🥶broke below trend support zone, but used local trend resistance mentioned in last analysis as new support area 🙈
if it can build from that and climb back above trend support/.0002565 then we may just see the mother of all squeezes 🚀
lets see what happens though, good luck! see you soon with more charts ⛄

$LUNCUSDT UPDATE!!!Hi Snipers,
Please refer to the recording for the next price levels and scenarios.
Thanks
MS

Terra Classic (LUNC) formed bullish Cypher for upto 88% pumpHi dear friends, hope you are well, and welcome to the new update on Terra Classic (LUNC) with US Dollar pair.
On a daily time frame, LUNC has formed a bullish Cypher pattern.
Note: Above idea is for educational purpose only. It is advised to diversify and strictly follow the stop loss, and don't get stuck with trade

Terra LUNC showing the classic signsThree phases of a price move is potentially showing in Lunc ... Consolidation (tight price range), followed by manipulation (clearing stops early positions looking for a breakout), finally profit relase usually after a major economic event like this week's Fed rate announcement.

LUNC + Mathhey traders
look at the chart
there's 2 strong lvl that have 3 confirmations with math
if we lose this level, there's a high chance hit the lower level
what u think?
share ur chart and leave a comment

LUNC pump and dumpHello, im taking a short position here with very close stoploss. risk / reward ratio is very good.
im using very tight stoploss and current price is the entry.
LUNC is a dead chain and a pump and dump. the "burn" mechanism is stupid.
DYOR
