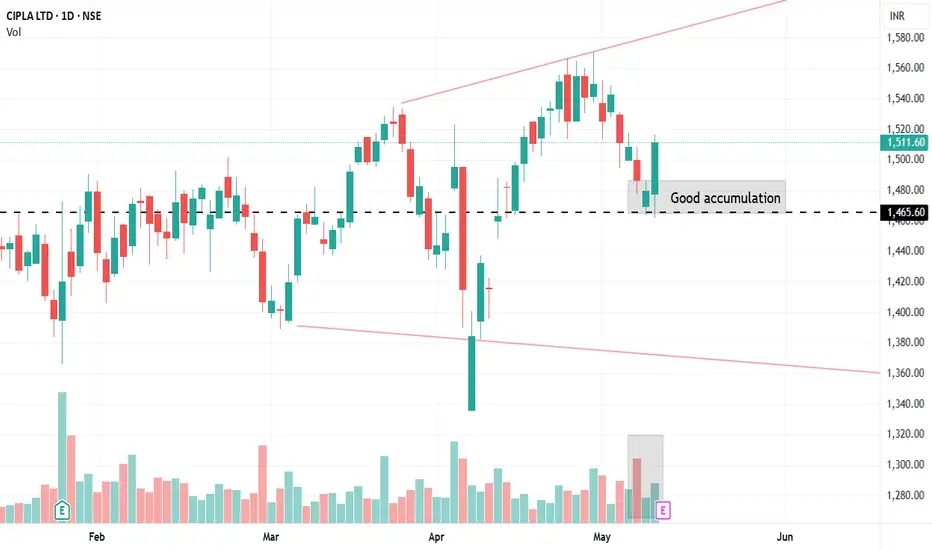
Cipla good breakout with volume supportCipla 1511 has given a good breakout with volume support. with 1465 as support we expect nit could move to 1600.
On valuation it is trading at 24 P/E of its FY26 EPS of an average of 27 P/E which is 1671 that made us to believe it is available at discount.
0.8 USD
623.62 M USD
3.25 B USD
About CIPLA LTD
Sector
Industry
CEO
Umang Vohra
Website
Headquarters
Mumbai
Founded
1935
FIGI
BBG000Q4YY55
Cipla Ltd. engages in the manufacture and distribution of healthcare products and bulk drugs. It operates through the following segments: Pharmaceuticals and New Ventures. The Pharmaceuticals segment develops, manufactures, sells and distributes generic or branded generic medicines as well as active pharmaceutical ingredients. The New Ventures segment includes the operations of the two wholly owned subsidiaries, Cipla Health Ltd., a consumer healthcare company and Cipla BioTec Pvt. Ltd, which is into the business of Biosimilars. The company was founded by Khwaja Abdul Hamied in 1935 and is headquartered in Mumbai, India.
Related stocks
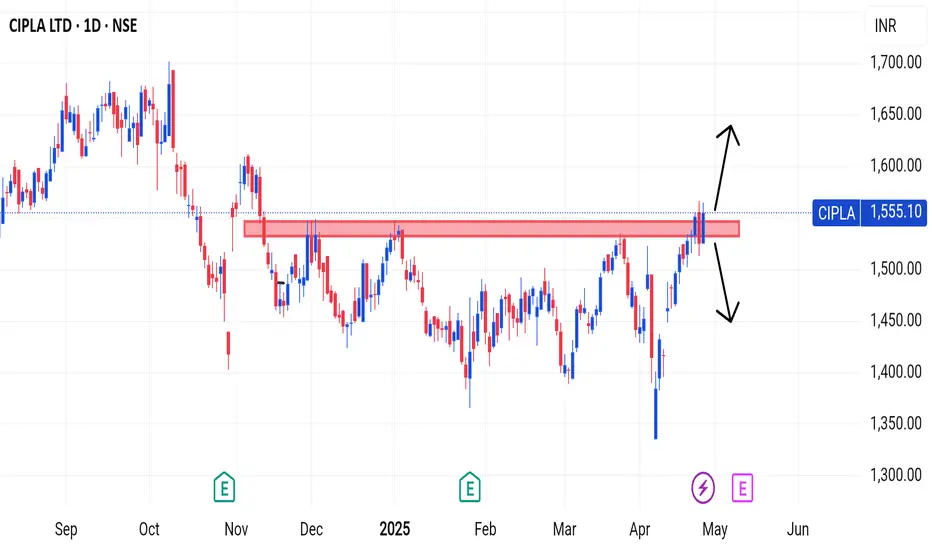
CIPLAA very good breakout has been given above the resistance level. Now uptrends can be expected. Sales are expected to continue if it falls below the resistance level
If you find this helpful and want more FREE forecasts in TradingView, Hit the 'BOOST' button
Drop some feedback in the comments below!
Go long in CIPLAIt's a very good breakout in Cipla on intraday basis. From here, we can expect targets of 1610 & 1680. Hold for 1-2 weeks.
Stoploss against this investment can be placed near 1510.

CIPLA CHANNEL BREAKOUT AND FORMING CUP HANDLECipla broke long term Channel and doing retest on Daily TF
Cup and handle forming on 1 hr TF
Buy on dips till 1440-1445
Idea Invalid if closing below 1434 on Daily TF

CIPLA Stock is facing resistance in daily time frame#CIPLA
Stock is facing resistance in daily time frame .Can expect good upmove once it breaks and sustains above the resistance.Keep on Radar.
Disclaimer:-All views are my personal and only for educational purpose.
#StockMarketIndia
#LetsLearnTogether

CIPLA has possibility to move towards 850?CIPLA has moved below all moving average and also it has crossed lakshman rekha.
It has possibility to move towards below level,
1313 - 1150 - 1015 - 850 - 750

Cipla fresh swing buyingWe can see more divergence in volume and more money flux in cipla. Trade with care.

CIPLA ......Sharp fall May Expected in Few DaysCipla has broken the Decending Triangle Structure .....Reteted the Broken Line today.....There are Several Gaps (Unfilled Order Blocks) in down side .....Hopefully we gonna see a sharp fall soon.....Below Red lines are GAPS to be filled up ...

CIPLA - BUY - 1755CIPLA to hit the lower levels of 1268 before flying to the higher levels of 1755.
The Stock has shown consolidation for the last 2 months .

cipla break down | short view Charts for Educational purposes only.
Please follow strict stop loss and risk reward if you follow the level.
Thanks,

See all ideas
Summarizing what the indicators are suggesting.
Oscillators
Neutral
SellBuy
Strong sellStrong buy
Strong sellSellNeutralBuyStrong buy
Oscillators
Neutral
SellBuy
Strong sellStrong buy
Strong sellSellNeutralBuyStrong buy
Summary
Neutral
SellBuy
Strong sellStrong buy
Strong sellSellNeutralBuyStrong buy
Summary
Neutral
SellBuy
Strong sellStrong buy
Strong sellSellNeutralBuyStrong buy
Summary
Neutral
SellBuy
Strong sellStrong buy
Strong sellSellNeutralBuyStrong buy
Moving Averages
Neutral
SellBuy
Strong sellStrong buy
Strong sellSellNeutralBuyStrong buy
Moving Averages
Neutral
SellBuy
Strong sellStrong buy
Strong sellSellNeutralBuyStrong buy
Displays a symbol's price movements over previous years to identify recurring trends.