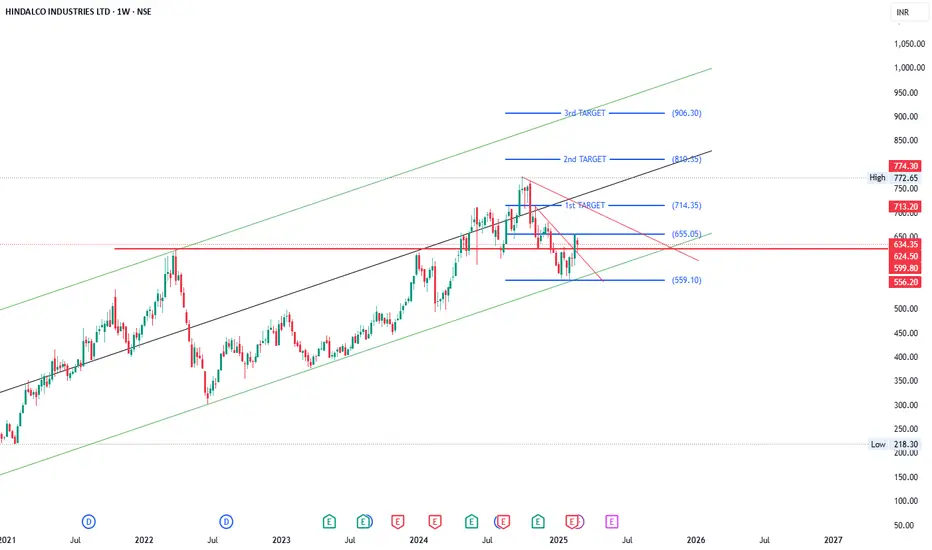
Hindalco Short_Near Resistance_Bearish Engulfing candleHindalco Short:
- Price near Resistance
- Bearish Engulfing Pattern
- SL: Today's High
- Target 20 DEMA
- Enter when price is favorable in lower timeframe
0.85 USD
1.89 B USD
28.21 B USD
About HINDALCO INDUSTRIES LTD
Sector
Industry
CEO
Satish P. Pai
Website
Headquarters
Mumbai
Founded
1958
FIGI
BBG000BYP5L0
Hindalco Industries Ltd. engages in the production and marketing of aluminium and copper products. It operates through the Aluminium, Copper, Novelis, and All Other segments. The Aluminium segment manufactures and sells hydrate and alumina, and aluminium products. The Copper segment is in the business of manufacturing and selling of copper cathode, continuous cast copper rods, sulphuric acid, DAP & Complexes, gold, silver, and other precious metals. The Novelis segment engaged in producing and selling aluminium sheet and light gauge products. The company was founded by Ghanshyam Das Birla on December 15, 1958 and is headquartered in Mumbai, India.
Related stocks

Hindalco Industries Ltd view for Intraday 21st May #HINDALCO Hindalco Industries Ltd view for Intraday 21st May #HINDALCO
Resistance 670 Watching above 671 for upside momentum.
Support area 650 Below 660 ignoring upside momentum for intraday
Watching below 649 for downside movement...
Above 660 ignoring downside move for intraday
Charts for Educational pu

Hindalco is giving pullback test.. Hindalco 656 is giving a pullback test. Volume pattern suggests bearishness. Below 640 we find will be bearish to drop down to 522 which could be considered for buying

Bullish on HINDALCOI put up in my earlier post last week that metal counters were looking Bullish and TATA STEEL did it's job.
Now is the turn for HINDALCO. Similar price structure, similar price action. Today morning, there has been a good breakout from congestion zone.
Long position can be built up for a Target of

Hindalco AnalysisI have analyzed Hindalco with Trend, candle pattern & Gann techniques. And found that it is looking weak. Stop loss is 716. And Target is 677,659. It is metal stock and due to global pressure it may break.

Hindalco-Bullish Swing- Very good signs of bullish momentum!
Buy above 644.05
Risk reward- 01:01
Target & Stoploss- 4.3%
1.Inside bar breakout found with bullish engulfing after forming 3 green soldiers- Good signs of momentum
2.Price has formed double bottom and hammer before reversal
3.Rejection from 0.318 Fibonacci level
4.Resistance turned to sup

Hindalco bouncing from SupportHindalco is at its Monthly and Weekly Support.
If it holds can show some theatrics as per Bullish Harmonic Pattern.
Metal Sector seems consolidating.
Do your own diligence.

SWING TRADE OPPORTUNITY - HINDALCOHindalco has taken proper weekly support, which is a nice opportunity to earn a decent profit from this script.
Missed HindalcoHindalco Completing 'W' pattern. This is the beauty of Market. No need to buy now but can see completing the pattern. Target is 676. hopes so it will give breakout after that

HINDALCONSE:HINDALCO
One Can Enter Now ! Or Wait for Retest of the Trendline (BO) Or wait For better R:R ratio
Note :
1.One Can Go long with a Strict SL below the Trendline or Swing Low of Daily Candle.
2. Close, should be good and Clean.
3. R:R ratio should be 1 :2 minimum
4. Plan as per your RISK a

See all ideas
Summarizing what the indicators are suggesting.
Oscillators
Neutral
SellBuy
Strong sellStrong buy
Strong sellSellNeutralBuyStrong buy
Oscillators
Neutral
SellBuy
Strong sellStrong buy
Strong sellSellNeutralBuyStrong buy
Summary
Neutral
SellBuy
Strong sellStrong buy
Strong sellSellNeutralBuyStrong buy
Summary
Neutral
SellBuy
Strong sellStrong buy
Strong sellSellNeutralBuyStrong buy
Summary
Neutral
SellBuy
Strong sellStrong buy
Strong sellSellNeutralBuyStrong buy
Moving Averages
Neutral
SellBuy
Strong sellStrong buy
Strong sellSellNeutralBuyStrong buy
Moving Averages
Neutral
SellBuy
Strong sellStrong buy
Strong sellSellNeutralBuyStrong buy
Displays a symbol's price movements over previous years to identify recurring trends.