HINDALCO
absorbing a swing trade opportunity in hindalco at current levels and stoploss is below the support level and target is 750 respectively
HINDA trade ideas

Hindalco Industries Ltd for Intraday 25th October #HINDALCO Hindalco Industries Ltd for Intraday 25th October #HINDALCO
Resistance 700. Watching above 702 for upside movement...
Support area 680. Below 690 ignoring upside momentum for intraday
Support 680.Watching below 678 for downside movement...
Resistance area 700
Above 690 ignoring downside move for intraday
Charts for Educational purposes only.
Please follow strict stop loss and risk reward if you follow the level.
Thanks,
V Trade Point

@HINDALCO long term inverstment call
🧲🧲🧲🧲🧲🧲🧲🧲🧲🧲🧲
HINDALCO
BUYING RANGE - 750-752
STOPLOSS 745
TARGET 770/795/832+++

HINDALCO FOLLOWING WAVEThere is clear visible that pattern formation is following wave analysiss as you can see 2 and fourth wave now look at 1 and third wave as well it shows next will be fifth and greater than first and third.now another concept is last week it is taken support at its gann fan cross(red line) which is .5 retracement level of fib.

Hindalco Industries- Bullish swing- Real movement may begin now! NSE:HINDALCO
09.10.2024
Buy-Above 728
Target 01-770
Target 02-794
Stop Loss-707
Risk Reward- 1:2
1.Doji and followed by engulfing candle stick formation
2.Side ways breakout and retracement found
3.Resistance turned to support level reaction
4.Upside movement volumes are more compared to downside.
Tomorrow volumes are crucial for further movement
5. Price crossed above 21 EMA.
6. RSI taken support in bullish zone
7. Reversal signals found at 0.382 Fibonacci level
8. Metal sector is in focus due to increased demand

Hindalco Hindalco made a quick retest of 496 which was a important QM Level on weekly chart and has shown reversal on LTF. Time to go long with
T1 - 625
T2 - 712
T3 - 835

Hindalco channel movementHindalco moving in a channel and price expected to reverse from channel top trendline which confluence with AB=CD harmonic pattern reversal zone.
Entry around 750, SL if price settles above 760 in 1 hr timeframe, target 710.

Hindalco LongHindalco
MTF Analysis
HindalcoYearly Demand Breakout 636
Hindalco 6 Month Demand Breakout 636
HindalcoQtrly Demand Breakout 620.5
HindalcoMonthly Demand BUFL 662
HindalcoWeekly Demand 698
HindalcoDaily Demand DMIP 730
ENTRY -1 730
SL 715
RISK 15
Potential Target 822
First Target Points 822
First recovery Target Points 107
Last Swing Low 608
Last Swing High 715
RR 7
RR 13%

HINDALCO - 4 months RECTANGLE══════════════════════════════
Since 2014, my markets approach is to spot
trading opportunities based solely on the
development of
CLASSICAL CHART PATTERNS
🤝Let’s learn and grow together 🤝
══════════════════════════════
Hello Traders ✌
After a careful consideration I came to the conclusion that:
- it is crucial to be quick in alerting you with all the opportunities I spot and often I don't post a good pattern because I don't have the opportunity to write down a proper didactical comment;
- since my parameters to identify a Classical Pattern and its scenario are very well defined, many of my comments were and would be redundant;
- the information that I think is important is very simple and can easily be understood just by looking at charts;
For these reasons and hoping to give you a better help, I decided to write comments only when something very specific or interesting shows up, otherwise all the information is shown on the chart.
Thank you all for your support
🔎🔎🔎 ALWAYS REMEMBER
"A pattern IS NOT a Pattern until the breakout is completed. Before that moment it is just a bunch of colorful candlesticks on a chart of your watchlist"
═════════════════════════════
⚠ DISCLAIMER ⚠
Breakout Area, Target, Levels, each line drawn on this chart and any other content represent just The Art Of Charting’s personal opinion and it is posted purely for educational purposes. Therefore it must not be taken as a direct or indirect investing recommendations or advices. Entry Point, Initial Stop Loss and Targets depend on your personal and unique Trading Plan Tactics and Money Management rules, Any action taken upon these information is at your own risk.
═════════════════════════════

Darvas Box Strategy - Break out Stock - Swing TradeDisclaimer: I am Not SEBI Registered adviser, please take advise from your financial adviser before investing in any stocks. Idea here shared is for education purpose only.
Stock has given break out. Buy above high. Keep this stock in watch list.
Buy above the High and do not forget to keep stop loss, best suitable for swing trading.
Target and Stop loss Shown on Chart. Risk to Reward Ratio/ Target Ratio 1:2.
Stop loss can be Trail when it make new box / Swing.
Be Discipline, because discipline is the key to Success in Stock Market.
Trade what you See Not what you Think.

HINDALCO INDUSTRIES LTDBreakout happend in this stock with rising 200dma and RS indicator is also showing strength.
Keep your risk and reward ratios according to your own preferance.
This is for educational purpose, do your own research before investing.

Crossover Swing + Breakout Trade - HINDALCO📊 Script: HINDALCO
📊 Sector: Non Ferrous Metals
📊 Industry: Aluminum and Aluminum Products
Key highlights: 💡⚡
📈 Script is trading at upper band of BB and giving breakout of it.
📈 Script is giving Cup & handle Pattern Breakout on daily chart.
📈 Already crossover in MACD.
📈 Double Moving Averages are giving crossover.
📈 Right now RSI is around 66.
📈 One can go for Swing Trade.
⏱️ C.M.P 📑💰- 717
🟢 Target 🎯🏆 - 810
⚠️ Stoploss ☠️🚫 - 672
⚠️ Important: Always maintain your Risk & Reward Ratio.
✅Like and follow to never miss a new idea!✅
Disclaimer: I am not SEBI Registered Advisor. My posts are purely for training and educational purposes.
Eat🍜 Sleep😴 TradingView📈 Repeat 🔁
Happy learning with trading. Cheers!🥂

Good Buy HindalcoHindalco is fundamentally a very good stock and has given good returns in the past. Currently, it has formed and given a breakout of a symmetric triangle pattern in a weekly timeframe with good volumen and trading in a daily/weekly channel.
It has cleared its first resistance which was a zone of 450 and is now ready to travel up to the upper body of the channel.
A fresh position can be created at CMP or in the dip in the price zone of 410-430. Keep a strict stop loss of 380. It has the potential to give a return of 20-30% in the coming weeks.
Happy trading :)

Hindalco Industries Ltd view for Intraday 3rd September #HINDALCHindalco Industries Ltd view for Intraday 3rd September #HINDALCO
Buying may witness above 690
Support area 679-680.. Below ignoring buying momentum for intraday
Selling may witness below 679
Resistance area 690
Above ignoring selling momentum for intraday
Charts for Educational purposes only.
Please follow strict stop loss and risk reward if you follow the level.
Thanks,
V Trade Point

Retest Breakout Level....NSE:HINDALCO trade at 700 level. stock Resistance at 715. Support at 600.
When its break resistance level you can watch it as a next resistance at 900.

Hindalco chart analysisHindalco chart analysis on daily time frame. If is breaks 714 then we can take position into this stock.
Please share your valuable feedback and follow for more charts.

Hindalco Industries Ltd view for Short Time Frame and for Intrad#HINDALCO
Hindalco Industries Ltd view for Short Time Frame and for Intraday
Need to sustain above 713 for Bullish pattern formation. Also Tripple bottom pattern for reversal.
Buying may witness above 713
Support area 700. Below ignoring buying momentum for intraday
Charts for Educational purposes only.
Please follow strict stop loss and risk reward if you follow the level.
Thanks,
V Trade Point

HINDALCO INDUSTRIES LTD S/RSupport and Resistance Levels:
Support Levels: These are price points (green line/share) where a downward trend may be halted due to a concentration of buying interest. Imagine them as a safety net where buyers step in, preventing further decline.
Resistance Levels: Conversely, resistance levels (red line/shade) are where upward trends might stall due to increased selling interest. They act like a ceiling where sellers come in to push prices down.
Breakouts:
Bullish Breakout: When the price moves above resistance, it often indicates strong buying interest and the potential for a continued uptrend. Traders may view this as a signal to buy or hold.
Bearish Breakout: When the price falls below support, it can signal strong selling interest and the potential for a continued downtrend. Traders might see this as a cue to sell or avoid buying.
20 EMA (Exponential Moving Average):
Above 20 EMA: If the stock price is above the 20 EMA, it suggests a potential uptrend or bullish momentum.
Below 20 EMA: If the stock price is below the 20 EMA, it indicates a potential downtrend or bearish momentum.
Trendline: A trendline is a straight line drawn on a chart to represent the general direction of a data point set.
Uptrend Line: Drawn by connecting the lows in an upward trend. Indicates that the price is moving higher over time. Acts as a support level, where prices tend to bounce upward.
Downtrend Line: Drawn by connecting the highs in a downward trend. Indicates that the price is moving lower over time. It acts as a resistance level, where prices tend to drop.
RSI: RSI readings greater than the 70 level are overbought territory, and RSI readings lower than the 30 level are considered oversold territory.
Combining RSI with Support and Resistance:
Support Level: This is a price level where a stock tends to find buying interest, preventing it from falling further. If RSI is showing an oversold condition (below 30) and the price is near or at a strong support level, it could be a good buy signal.
Resistance Level: This is a price level where a stock tends to find selling interest, preventing it from rising further. If RSI is showing an overbought condition (above 70) and the price is near or at a strong resistance level, it could be a signal to sell or short the asset.
Disclaimer:
I am not a SEBI registered. The information provided here is for learning purposes only and should not be interpreted as financial advice. Consider the broader market context and consult with a qualified financial advisor before making investment decisions.

HINDALCO Longperfect retest of the breakout we had post 4 years or so of ranging. We should now start moving up towards the tp targets. Patience and manage volatility.

Hindalco Nearing Bullish BreakoutHindalco Industries Ltd is currently in a consolidation phase and approaching a potential bullish breakout. Key levels include Resistance 1 at 687 and Strong Resistance at 709. A decisive move is anticipated soon.

HINDALCO INDS - CUP & HANDLEHINDALCO INDS has formed a Cup & Handle pattern on its weekly chart. This pattern took over 2 years to develop. It is now retesting and has formed a hammer candle. The stock may dip slightly to touch the 50 EMA before reversing upward.
Key Takeaway : Identifying support and resistance levels is crucial. Two years ago, the 622 level was a resistance but has now become support after being broken. The Cup formation happened at the 50 EMA, which provided support and then reversed. It has since re-tested this old resistance, which should now act as support. The hammer candle near the 50 EMA suggests a potential reversal. The stock may stay at this level for a few days or start moving up in the coming week.
This is for learning and educational purposes only, not financial advice.

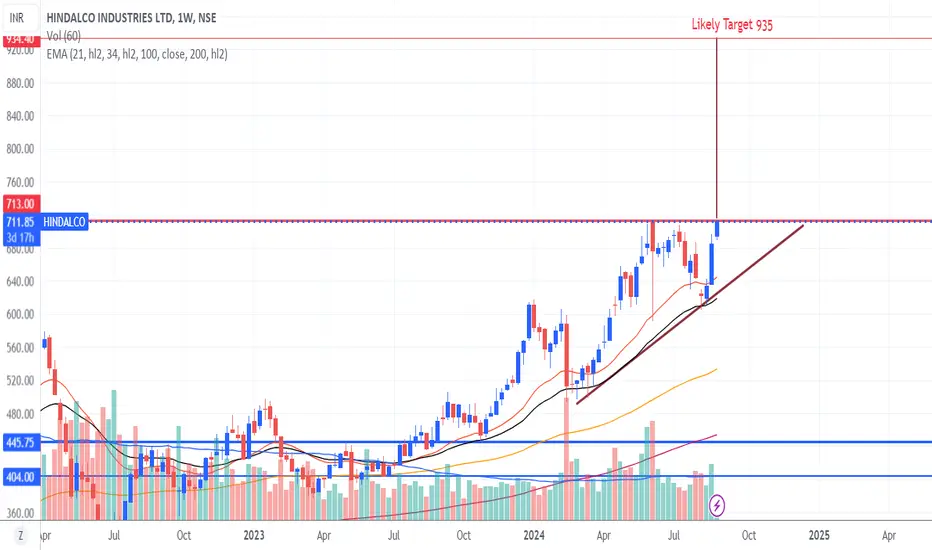
HINDALCO MY VIEW My view in hindalco ltd for upcoming days, there will positive uptrend in chart
Risk warnings and investment disclaimers are important for investors to understand the potential risks and conflicts of interest associated with an investment12. Risk warnings are used to explain possible reasons why an investment’s outcome might suffer losses, while investment disclaimers ensure that the material, research or investment advice discloses potential conflicts of interest1. Disclaimers and exclusion clauses in contracts are used to limit liability for injury, loss or damage3.
