Review and plan for 29th April 2025 Nifty future and banknifty future analysis and intraday plan.
Quarterly results analysis.
This video is for information/education purpose only. you are 100% responsible for any actions you take by reading/viewing this post.
please consult your financial advisor before taking any action.
----
−0.10 USD
−16.99 M USD
490.71 M USD
About THE INDIA CEMENTS LTD
Sector
Industry
CEO
Suresh Vasant Patil
Website
Headquarters
Chennai
Founded
1946
FIGI
BBG000Q1B7P3
India Cements Ltd. is a holding company, which engages in the manufacture and sale of cement and clinker. It operates through the following brands: Sankar Super Power, Coromandel King, and Raasi Gold. The company was founded by S. N. N. Sankaralinga Iyer and T.S. Narayanaswami on February 21, 1946 and is headquartered in Chennai, India.
Related stocks

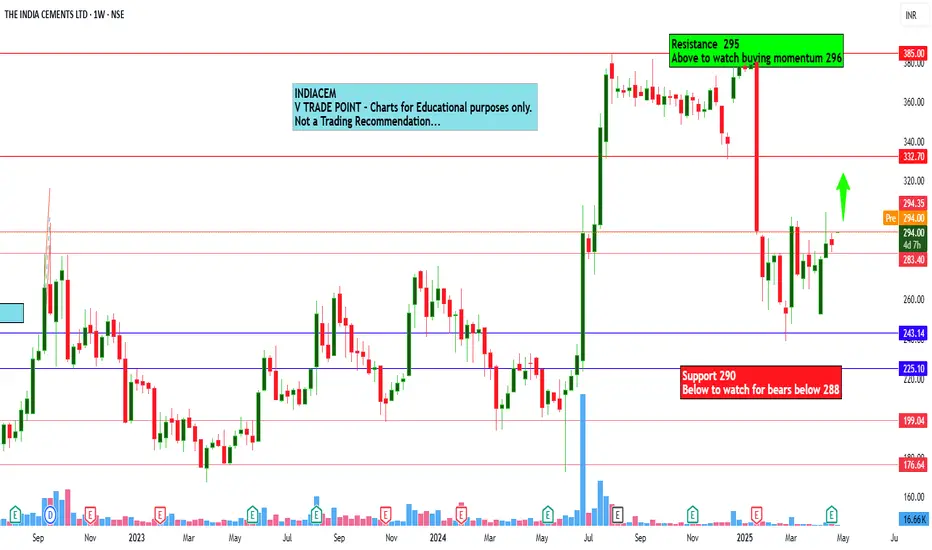
The India Cements Ltd view for Intraday 28th April #INDIACEM The India Cements Ltd view for Intraday 28th April #INDIACEM
Resistance 295 Watching above 296 for upside movement...
Support area 290 Below 295 ignoring upside momentum for intraday
Watching below 288 for downside movement...
Above 295 ignoring downside move for intraday
Charts for Educational
INDIACEM BREAKOUTGood volume
Good breakout
Potential upside movement possible
4-5% expected
Don't be greedy. Max one month.


Key Support / Resistance Breakout - Swing TradeDisclaimer: I am not a Sebi registered adviser.
This Idea is publish purely for educational purpose only before investing in any stocks please take advise from your financial adviser.
Key Support & Resistance Breakout. Stock has give Breakout of Resistance level. Keep in watch list. Buy above the h

IndiaCements for LongIndia Cement has consolidated for 6 months after a steep rise. Now again i see a good momentum build up.. and if cross 390 again it can go for 10-15%

India cement Classic Flag & pole now 360 Watch out classic flag and pole with huge accumulation sign.
Take delivery as per your risk appetite target and stop loss as mentioned.

India Cements can jump after solid consolidationIndia Cements Ltd. is a holding company, which engages in the manufacture and sale of cement and clinker. It operates through the following brands: Sankar Super Power, Coromandel King, and Raasi Gold.
India Cements Ltd. CMP is 358.30. The positive aspects of the company are Company with Low Debt,

India Cements - Long Setup (Swing Trade)India Cements is approaching a critical zone for a potential long trade setup. Here’s the plan:
Entry Zone: 363.95
Entry Price: Once a 15-minute candle breaks above 363.95 , the high of that candle will confirm the entry.
Target: 394.85
Stop Loss: 348.50 (Triggered if a daily candle c

India Cement Daily Timeframe analysis for Long Term
NSE:INDIACEM Strong rally in monthly timeframe as well as it is consolidating too much in daily timeframe.
Can go long above 376 with SL of 364.
Targets highlighted in Blue.
Already published idea is in link.

See all ideas
Summarizing what the indicators are suggesting.
Oscillators
Neutral
SellBuy
Strong sellStrong buy
Strong sellSellNeutralBuyStrong buy
Oscillators
Neutral
SellBuy
Strong sellStrong buy
Strong sellSellNeutralBuyStrong buy
Summary
Neutral
SellBuy
Strong sellStrong buy
Strong sellSellNeutralBuyStrong buy
Summary
Neutral
SellBuy
Strong sellStrong buy
Strong sellSellNeutralBuyStrong buy
Summary
Neutral
SellBuy
Strong sellStrong buy
Strong sellSellNeutralBuyStrong buy
Moving Averages
Neutral
SellBuy
Strong sellStrong buy
Strong sellSellNeutralBuyStrong buy
Moving Averages
Neutral
SellBuy
Strong sellStrong buy
Strong sellSellNeutralBuyStrong buy
Displays a symbol's price movements over previous years to identify recurring trends.