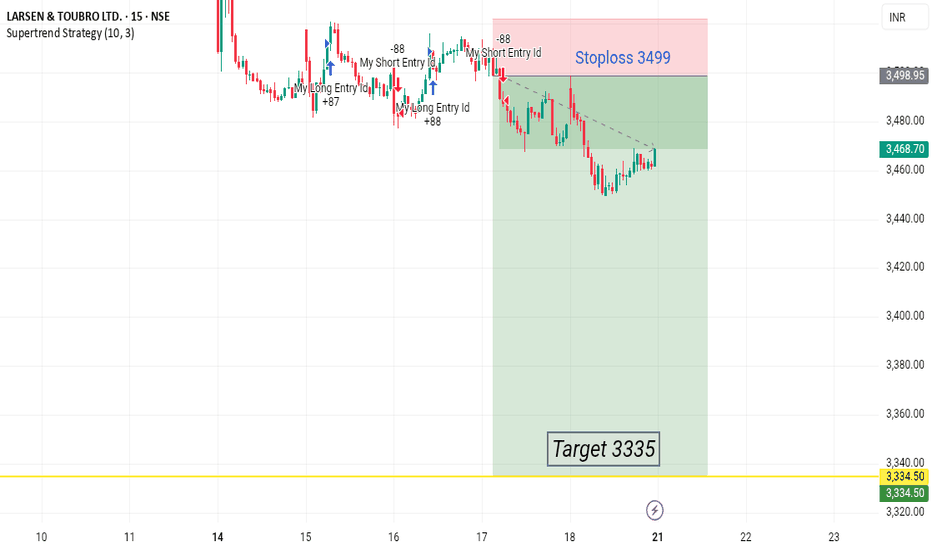
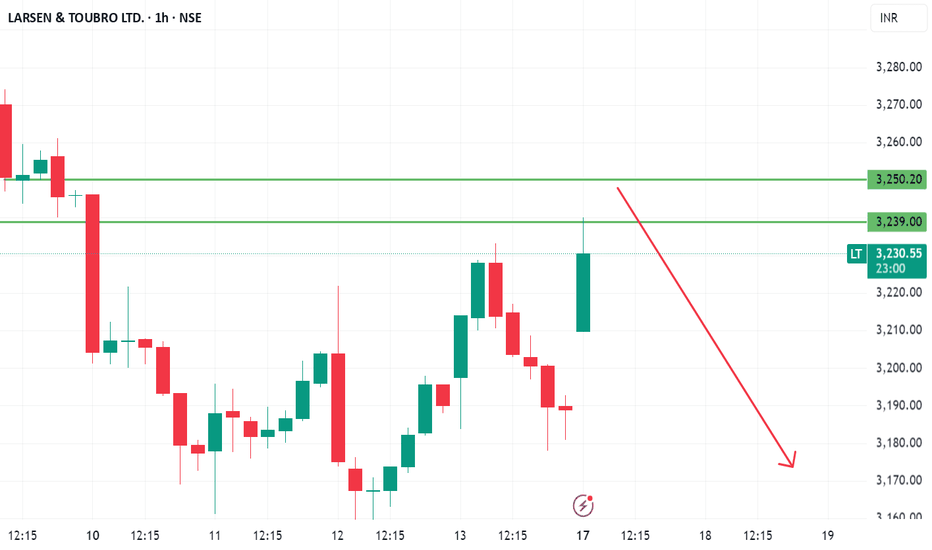
LS_TB trade ideas
LARSEN📈 Trade Plan
Element Value
Trade Type BUY
Entry Price ₹3477
Stop Loss ₹3284
Risk ₹193
Target ₹4581
Reward ₹1104
RR Ratio 5.7
Last High ₹3960
Last Low ₹2856
🧠 Logic Recap
All timeframes (HTF, MTF, ITF) show a clear uptrend.
Most demand zones align between ₹2856 – ₹3477, showing strong cluster support.
The entry point ₹3477 sits right at the upper end of current MTF/ITF demand zones—indicating a logical breakout play from strong support.
Target ₹4581 is ambitious but aligns well given the bullish structure and favorable Risk-Reward of 5.7x.
✅ Conclusion
This is a high-conviction long setup:
All trends are aligned UP.
Demand zones are tight and overlapping (strong support base).
Entry is at a high-quality zone (weekly/daily demand).
SL is just below the proximal line.
Target is achievable with decent momentum post-breakout of previous high (₹3960).
🔍 Multi-Timeframe (MTF) Analysis Summary
Timeframe Trend Demand Zone Type Proximal Distal Avg Zone
Yearly UP BUFL 2211 1456 1834
Half-Yearly UP Rally-Rally 2483 2420 2452
Quarterly UP BUFL 3058 2856 2957
Monthly UP BUFL 3124 2856 2990
Weekly UP BUFL 3477 3284 3381
Daily UP DMIP Support 3477 3284 3381
240/180/60M UP BUFL 3328 3299 3314
🔸 Average Demand Zones by Frame
HTF Average: 2414
MTF Average: 3250
ITF Average: 3314
Trade Points Avg: 2993
#LARSEN AND TOUBRO SUPPLY ZONEExplore key supply zones for Larsen and Toubro (L&T) with detailed technical analysis. These zones act as potential resistance levels where price reversals or pullbacks are likely, providing strategic entry and exit points for traders. Perfect for swing trading, breakout strategies, and risk management.
Larsen & Toubro Ltd. | Strong Support Zone & RSI Breakout AlertLarsen & Toubro Ltd. | Strong Support Zone & RSI Breakout Alert 🚀
Price is testing a strong demand zone, showing signs of reversal. RSI is approaching the 52 resistance level—if it breaks above, momentum could shift bullish! 📈
A good risk-reward setup for buyers if the support holds. Watching for confirmation! 🔍
Disclaimer:
This is not financial advice. Please do your own research or consult with a financial advisor before making any investment decisions. Investments in stocks can be risky and may result in loss of capital.
#LT Supply ZoneA LT Supply Zone (Long-Term Supply Zone) in trading refers to a significant price level on a chart where sellers have previously overwhelmed buyers, leading to a strong downward price movement. These zones are identified by areas where price has made a sharp drop after a period of consolidation, indicating a concentration of selling pressure. Traders often watch these zones for potential reversals or breakouts, as they can act as key resistance levels in the future. The concept is commonly used in supply and demand trading strategies.
LT | LONG REVERSAL | SWINGLT is showing signs of Reversal on the Hourly chart from the lows.
While this is not a trend change, hence long position needs to be built up only on a short term basis.
Target expected within a week or two - 3400.
Overall long term trend still remains bearish with scope of further correction.
L&T (Larsen & Toubro) – Critical Support Test! **⚠️ L&T (Larsen & Toubro) – Critical Support Test! 🚨**
🔍 **Range-Bound, But For How Long?**
L&T has been stuck inside a **broad consolidation zone** between **₹3,237 (support)** and **₹3,887 (resistance)** for months. Now, price action is testing the lower boundary – a **break below this could trigger a sharp fall!**
📉 **Why This Support is Crucial?**
✅ **Multiple Tests of ₹3,237 – Buyers Holding, But Pressure Building**
✅ **Trading Below 44-SMA (₹3,865) – Bearish Bias Growing**
✅ **Breakdown Below ₹3,237 Could Lead to ₹3,000 or Lower**
📊 **Key Levels to Watch:**
🔹 **Resistance:** ₹3,865 - ₹3,887 (Upper Box Limit)
🔹 **Support:** ₹3,237 (Lower Box Limit) – Break Could Accelerate Selling
💡 **Trading Plan:**
🔻 **Failure to Hold ₹3,237 → Bearish Breakdown**
🔻 **Reversal with Strong Bounce → Possible Move Back to ₹3,600+**
🔻 **Watch Volume & Price Action for Confirmation**
⚠ **BIG MOVE COMING – Will Support Hold or Break?** 🔥👀
Larsen & Toubro (L&T) - Potential Breakout?
The chart shows L&T consolidating within a descending trendline. A break above this trendline could signal a bullish breakout.
Key Levels:
Resistance: Trendline, 3,490
Support: 3,400
Stop Loss: Hourly Close below 3,367
Potential Targets:
First Target: 3,673 - 3,709
Second Target: 3,845
Disclaimer: This is for educational purposes only and not financial advice.
What are your thoughts on L&T?
#L&T #LarsenAndToubro #NSE #StockMarket #Trading #TechnicalAnalysis #Breakout
Please note: This analysis is based on the provided chart and current market conditions. Market dynamics can change rapidly, so it's crucial to conduct your own due diligence and risk management before making any trading decisions.
L&T 2 targets 1 month time frame Lets Develop with Growth Financial Performance
Revenue Growth: For FY 2023-24, L&T reported a revenue of ₹1,85,000 crore, marking a 15% year-over-year increase.
Profitability: The company achieved an EBITDA of ₹25,000 crore (+18% YoY) and a net profit of ₹12,500 crore (+20% YoY), with an operating margin of 13.5%.
Return on Equity (RoE): L&T's RoE stands at 16.8%, indicating efficient capital utilization.
Valuation Metrics: L&T trades at a P/E ratio of 22x (FY25E), which is below its historical average, suggesting potential for price appreciation.
Trade Setup and Exit Strategy
Current Market Position
Current Market Price: ₹3,440 (as of January 29, 2025)
Target Price: ₹4,100 (19% upside potential)
Trade Setup
Entry Point: If not already invested, consider entering at or below the current market price of ₹3,440, given the potential upside and strong fundamentals.
Stop-Loss: Set a stop-loss at around ₹3,200 to limit downside risk, considering the bear case scenario outlined in the report.
Exit Strategy
Target Exit: Aim to exit at or near the target price of ₹4,100 by the end of February, assuming the stock reaches this level.
Monitoring: Regularly monitor market conditions, company announcements, and sector developments that could impact L&T's stock price.
Adjustments: Be prepared to adjust the exit strategy based on market volatility, macroeconomic factors, or significant news affecting L&T or the broader market.
L&T on the runLarsen & Toubro Limited (L&T) is a prominent Indian multinational engaged in technology, engineering, construction, manufacturing, and financial services. As of January 10, 2025, its stock price on the National Stock Exchange of India (NSE: LT) was ₹3,536.15, with a 52-week range between ₹3,175.05 and ₹3,963.50.
In recent trading sessions, L&T's stock has exhibited mixed performance. On January 15, 2025, the stock rose by 1.03% to ₹3,501.15, outperforming the BSE SENSEX Index, which increased by 0.29% to 76,724.08. However, it remained below its 52-week high of ₹3,963.00, set on December 10, 2024
Profitability:
1) Revenue Growth: In the fiscal year ending March 31, 2024, L&T reported consolidated revenues of ₹221,113 crore, marking a 21% year-over-year increase.
2) Net Profit: The company achieved a consolidated profit after tax (PAT) of ₹13,059 crore for the same period, reflecting a 25% growth compared to the previous year.
3) EBITDA Margins: L&T's EBITDA margins vary across its business segments. For instance, the Energy Projects segment reported an EBITDA margin of 10.0% for the year ended March 31, 2024, an improvement from 9.1% in the previous year.
L&T INDIA | LARSEN & TOUBRO
Financial Health:
1)Order Inflow: The company secured orders worth ₹302,812 crore during the year ended March 31, 2024, registering a robust year-over-year growth of 31%.
2)Debt Levels: As of March 31, 2024, L&T's total debt stood at ₹1,05,000 crore, with a debt-to-equity ratio of 1.5, indicating a moderate level of leverage.
3) Credit Rating: Fitch Ratings has acknowledged L&T's steady margins, supported by adequate risk management and diversification into stable sectors.
Recent Developments:
In October 2024, L&T reported a 5% rise in its second-quarter profit, reaching ₹33.95 billion, driven by the faster execution of previously commissioned projects.
The company maintained its full-year order growth forecast, reflecting confidence in its business outlook.
Overall, L&T demonstrates strong profitability and maintains a healthy financial position, supported by consistent revenue growth, effective cost management, and a robust order book. However, it's essential to consider market dynamics and sector-specific challenges when evaluating the company's future performance.
LT READY TO SKY ROCKETLT has given a beautiful breakout today from the long standing Resistance level as marked on chart. With its well-established bullishness the stock is bound to go in for a long bull run. Targets can be open. Long Term Targets to be around 4500 level.
Simple Price Action at its best.
P.S. It has also given a breakout on the weekly TF, which is even more of a reason to buy the stock. Fundamentals look good too.
LT Targets ₹3992! Hourly Swing Trade in Action!Larsen & Toubro (LT), on the 1-hour timeframe, has showcased a precise long trade setup using the Risological Swing Trading Indicator . With TP1 and TP2 already achieved, the trade now targets higher levels as momentum sustains.
Key Levels:
TP1: 3658.85 ✅
TP2: 3786.40 ✅
TP3: 3913.95 (Pending)
TP4: 3992.75 (Pending)
Technical Analysis:
The price crossed the Risological Trend Line , giving a clear bullish entry signal at 3580.00, backed by strong market sentiment.
The stop-loss was secured at 3516.25 to ensure a well-defined risk-reward ratio.
The steady rise above the trend line and the achievement of initial targets highlight the reliability of the system.
The trade remains bullish, with the price continuing to climb steadily toward TP3 and TP4, suggesting further upside potential.
LT LT has given +260% from 2016 to today 2024from 2016 to today 2024
LT has given +260% return including stock split (2:1)
I also saw a fall of -43% from my buying price..thought of selling LT,
however as a bluechip company , it hust hold it
NOw,on Nov 2024 cmp : 3660
Invested: 64K
Unrealised profit: 1.7 lac


