ADITYA BIRLA CAPITAL LTD – Trend Reversal Breakout Trade🧠 Technical Highlights:
Downtrend Channel Breakout: Clear breakout from a falling channel pattern
Resistance Break: Strong breakout above supply zone of ₹204–₹210
Volume: Massive volume spike validates bullish strength
RSI: Above 70, indicating strong momentum but not overbought yet
🟢 Buy Setup
0.16 USD
394.14 M USD
4.82 B USD
About ADITYA BIRLA CAPITAL LTD.
Sector
Industry
CEO
Vishakha Vivek Mulye
Website
Headquarters
Mumbai
Founded
2007
FIGI
BBG00HY9LB89
Aditya Birla Capital Ltd. engages in the provision of financial services. It operates through the following segments: NBFC, Housing Finance, Life Insurance, Asset Management, General Insurance Broking, Stock and Securities Broking, Health Insurance, and Other Financial Services. The company was founded on October 15, 2007 and is headquartered in Mumbai, India.

Analysis and Summary of the ADITYA BIRLA CAPITAL LTD. (NSE: ABCA🔍 Technical Overview:
Current Price: ₹200.25
Recent Price Action: Price is attempting a bounce after forming a higher low near ₹187.83.
📈 Key Technical Levels:
Fibonacci Levels:
0.0 (Support): ₹187.83
0.5 (Mid-Resistance): ₹204.67
0.618 (Golden Ratio): ₹208.64
1.0 (Previous High): ₹221.51
1.61

aditya birla capitalAditya Birla Capital, a large Indian financial services company, has invested 400 million Indian Rupees (approximately $4.8 million USD) into a company or entity called ABCDL.

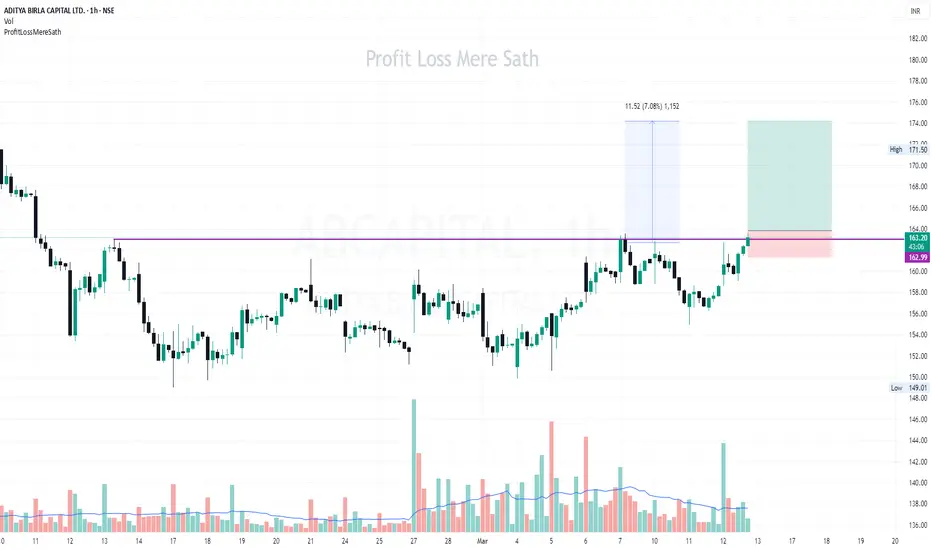
ABCAPITAL | Buy above 163 | SL below 161 | Target 174Disclaimer:
This is not financial advice. Please do your own research or consult with a financial advisor before making any investment decisions. Investments in stocks can be risky and may result in loss of capital.
ABCAPITAL|Buy plan can be considered in Future with a strict SLDisclaimer:
This is not financial advice. Please do your own research or consult with a financial advisor before making any investment decisions. Investments in stocks can be risky and may result in loss of capital.

$ABCAPITAL long term showing good signsNSE:ABCAPITAL long term showing good signs. since monthly supply is taken out probably good accumulation can start.

Aaditya capital forming bulish bat pattern Aaditya capital forming bulish bat pattern if it will reach at the price reverse zone then it can go up side will see the result.. cmp 184 on 05.01.2025

The weekly chart of Aditya Birla Capital Ltd
The weekly chart of Aditya Birla Capital Ltd. (ABCAPITAL_1W) on the NSE showcases a significant trendline that has been acting as a robust support level. This trendline, drawn from the lows of late 2022 to mid-2023, has been a critical area where the price has oscillated multiple times, indicating

ABCAPITAL TECHNICAL VIEWThe chart shows a daily timeframe for **Aditya Birla Capital Ltd. (NSE)** with a notable **ABCD harmonic pattern**:
### **Key Technical Observations:**
1. **ABCD Pattern:**
- The chart depicts an ABCD bullish harmonic pattern, suggesting a potential reversal from point **D**.
- **Point B** ma

Aditya Birla Capital Ltd. (NSE: ABCAPITAL) Technical AnalysisCurrent Price: ₹201.60 (-0.82%)
Price Target (Jefferies): ₹265, maintained at Buy
Technical Overview
Price Action: The chart reflects a strong support level near ₹197-₹201, where the price is currently hovering. The support zone is reinforced by a trendline that has been respected several ti

See all ideas
Summarizing what the indicators are suggesting.
Oscillators
Neutral
SellBuy
Strong sellStrong buy
Strong sellSellNeutralBuyStrong buy
Oscillators
Neutral
SellBuy
Strong sellStrong buy
Strong sellSellNeutralBuyStrong buy
Summary
Neutral
SellBuy
Strong sellStrong buy
Strong sellSellNeutralBuyStrong buy
Summary
Neutral
SellBuy
Strong sellStrong buy
Strong sellSellNeutralBuyStrong buy
Summary
Neutral
SellBuy
Strong sellStrong buy
Strong sellSellNeutralBuyStrong buy
Moving Averages
Neutral
SellBuy
Strong sellStrong buy
Strong sellSellNeutralBuyStrong buy
Moving Averages
Neutral
SellBuy
Strong sellStrong buy
Strong sellSellNeutralBuyStrong buy
Displays a symbol's price movements over previous years to identify recurring trends.