MANABTC trade ideas


MANA, COMPRAR YA ! O ODIAS EL DINERO.MANA, COMPRAR YA ! O ODIAS EL DINERO.
KRANEO10
MUESTRAME EL CHART Y TE CONTARE LAS NOTICIAS.

MANA, SINO COMPRAS ERES RETRASADO.MANA, SINO COMPRAS ERES RETRASADO.
KRANEO10
COMPRA O ERES RETRASADO.
MANA RESPETANDO LA TRENDLINEMANA RESPETANDO LA TRENDLINE, A PUNTO DE VOLAR.
KRANEO10
TOMA TUS DESICIONES, YO NO TENGO NI IDEA.

INCREIBLE QUE MANA AUN NO PUMPEE INCREIBLE QUE MANA AUN NO PUMPEE
KRANEO10
NO TENGO NI IDEA DE LO QUE HABLO.

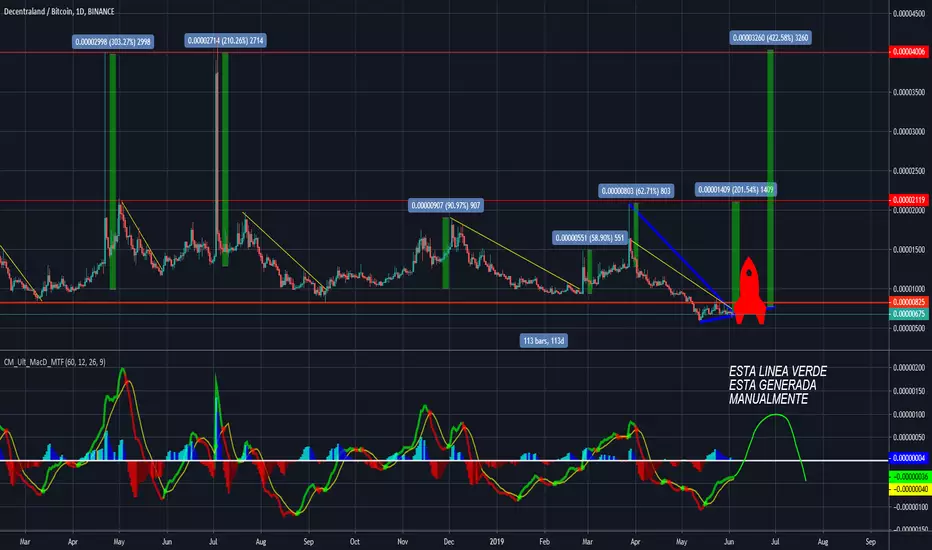
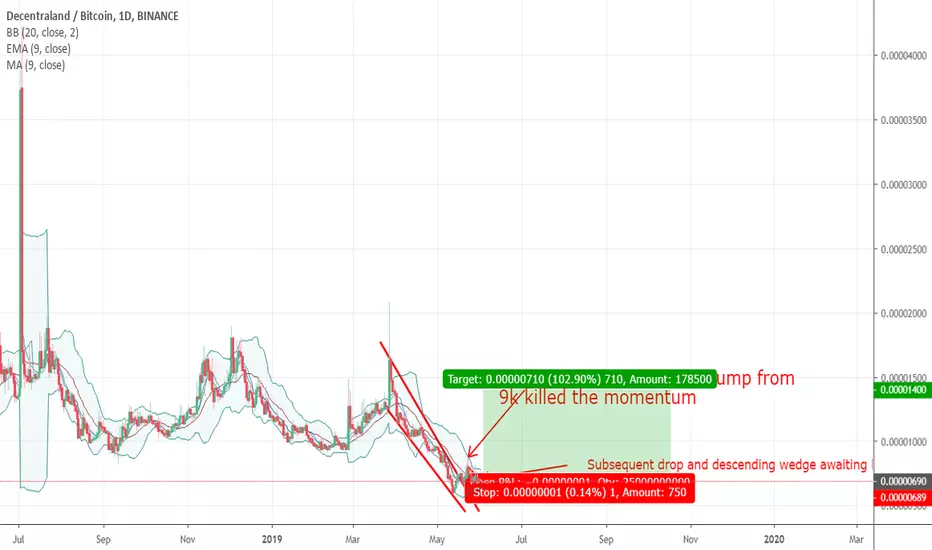
MANA breakout to return, real 100% Opportunity short termMANA broke out of its old descending channel and moved north really well, the momentum was killed by the BTC drop but now were bout to see another monumental breakout to the top, i'm looking for a 1 month 100% gain on this.


MANA, NO VENDER, SER HOLD ES DIFICILBueno, al parecer un mal dia para las alt coins, pero lo importante es ver que esta sucediendo en plazos cortos. Observar las tendencias en plazos cortos como en 4horas ayuda a entender que esta pasando en el chart diario, siempre es bueno poner la lupa a nivel "molecular" para entender como se comporta una materia. En fin, claramente se ve que el diario en este momento esta sufriendo una bajada, tipico de ciclo, en este caso ciclo alsista dado que la trendline de soporte o neckline aun no fue rota y esta en posicion ascendente. Simplemente hacer hold y esperar las proyecciones futuras en mi caso ya lo e hecho con esta monda en otros charts ( puedes verlo mas abajo ) aun tienes tiempo de comprar y sacar grandes beneficios.
KRANEO10
SOLO EL EXITO ME CONFORMA

MANABTC long MANABTC T/A
Total books: $1,822,204.27 (+13.22%)
Global Bids: $1,025,155.17 (+6.39%)
Global Asks:$797,049.1 (+22.01%)


MANA/BTC 300% to 600% P.P.Hello Friends,
Here is another tricky chart that shows nothing but a continuous channel. All it does is stay within the confines of this channel rarely breaking above the upper channel or below the lower channel. There has been 4 incidences when we saw a spike pass through the upper channel, 3 of which did so in a dramatic fashion and quickly reversed back into the channel. Now we have seen something new on two occasions. The lower channel has been breached and for the first time MANA is oversold.
What does all this mean? If we look underneath the lower channel, we can see several arched green arrows that spans a distance from one high to the next high. Notice how there is a pattern within the arches? The first high touched the upper channel, the next 2 highs were extreme spikes. That is 1,2,3 then the pattern repeats. 1 touches the upper channel, then the following 2 will breach the upper channel. If the pattern holds, then we are due for a spike "if it happens", we are at a 3 count within this crazy pattern idea.
Now let's look at this chart in a realistic way. MANA has never been oversold just as it hasn't breached the lower channel, this tells me we can expect a powerful move upward because we are oversold and had a breach of the lower channel. The indicators for TDS is at a 9 (signal) and there has been a continuous buy signal coming from Bill Williams Fractal ever since MANA became oversold. Fractal says only to buy and not sell. TDS is past the 9 count and in limbo. We are at rock bottom and what goes down must come up at some point. I think we are at that point now.
The other point is that this is a price channel and is on the bullish side of the tracks. The channel itself has not been able to maintain the predictable move up even though on 3 occasions, MANA has surpassed channel expectations. There is a possible chance this time around that when MANA moves to the measured expected move up "seen on this chart as channel target" that it will maintain this position as support in the near future. The biggest advocate is BTCs bull market of late, which has a great influence upon most ALT coins.
Details on the Chart.
This is my viewpoint and my opinion. I am not giving advice but only sharing what I see. Do not enter a trade on my TA but do your own homework.
Cryptocurrency is volatile and very risky. Never invest what you can't afford to lose and always educate yourself and continue to do so when making any kind of investment.
If you find this information helpful, then please hit the like button. Your support is appreciated. Thank you!
CYA on the next one...until then, the trend is your friend. Buying on the dip and selling on the hype.
Cheers!

S.O.T MAY Chart Off Week 2 MANA/BTCMana is accumulating along an hourly uptrend while hovering above a daily hold level and moving towards a daily downtrend.The hold level is also supported by a monthly level 3 sats below.
Buy - 847
Target 1 - 865
Target 2 - 888
Target 3 - 897
Target 4 -917
Stop Loss - 837
** Legend**
Monthly - Grey
Weekly - Yellow
Daily - Red
4 Hour - Green
Hourly - Blue

$MANA Reaching strong support at ~930sats...$MANA Reaching strong support at ~930sats...
UCTS Buy signal flashing on the 12H
RSI Starting to rise
No need to rush into this, for now it just to observe and set alerts just in case that the support provides volume...
#MANA

MANA long possibility to break out of Chanel 2019 Low, ready to MANA is lower than its been all year and sill on support, soon to break out of channel to move.

Decentralando MANA ReReReRe Test SuportBest entry in MANA, solid proyect with growin comunity.-
BINANCE:MANABTC

MANA is on strong weekly supportAs we see mana in now on strong weekly support . It has been moving in a long range scince jan-18 , so it can move 50% as a first target in next weeks .

MANA Long One of the best alt trend plays in crypto. Even better defined ranges, RR, stop loss, and take profit zones than DOGE
