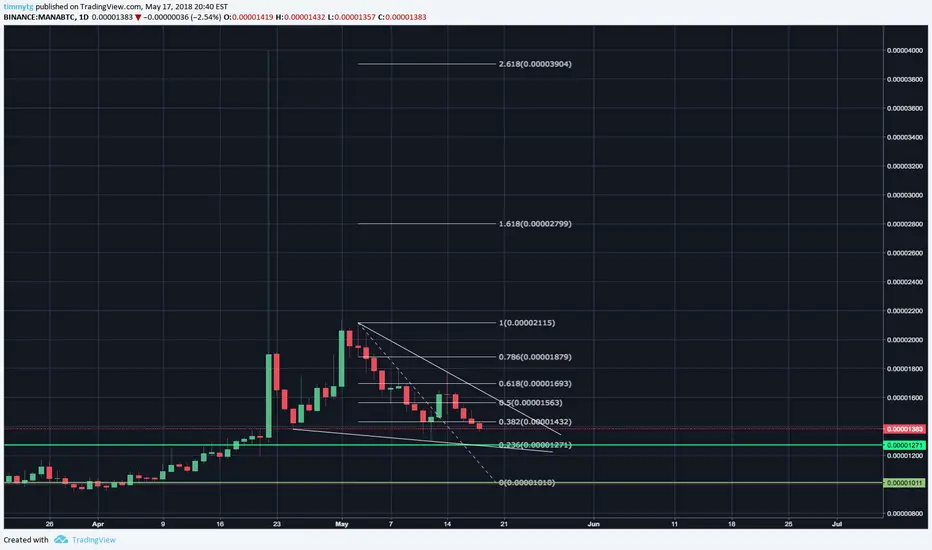
#MANA: breakout of falling wedge, Targeting KS & cloud #cryptoMana has broken out of the bullish falling wedge and crossed above 20DMA which is acting as a support level now at 1388 sats
Price has crossed above TS(Conversion-line) and looking to break KS(Base-line)
Resistance confluence region: 1390-1525 region
In the 4H t-f Mana has crossed above both TS & KS giving a buy signal
also TS bullish crossover of KS giving another buy signal
MACD bullish crossover of signal line, RSI above 50 & Stoch RSI also bullish
We can expect #mana to break above resitance region and Target higher fib levels
Target 1:1525
Target 2:1700
Target 3:1900
MANABTC trade ideas

MANA/BTCbuy half at entry 1271 following trend and/or the rest at 1010 if bitcoin falls to lows again
(if it holds around the 1200 for a couple of days buy the remanding at a price you desire)


DECENTRALAND TRADING POTENTIAL 100-150% PROFIT TARGETMANABTC is presently trading at the bottom side of the channel, and it presently look like going down for wave 2 of continuous waves.
With its participation on the ongoing consensus, i believe it worth looking into.
Targets are well defined on the chart.
Blue for Entry
Red for Stop Loss
Green for target for sell

MANA will retest the uptrend channel and how we can profitHopefully the chart is self explanatory, loet me know if you have any questions,
----
if you'd like to join our trading/gaming discord server, I post signals and details here!
discord.gg

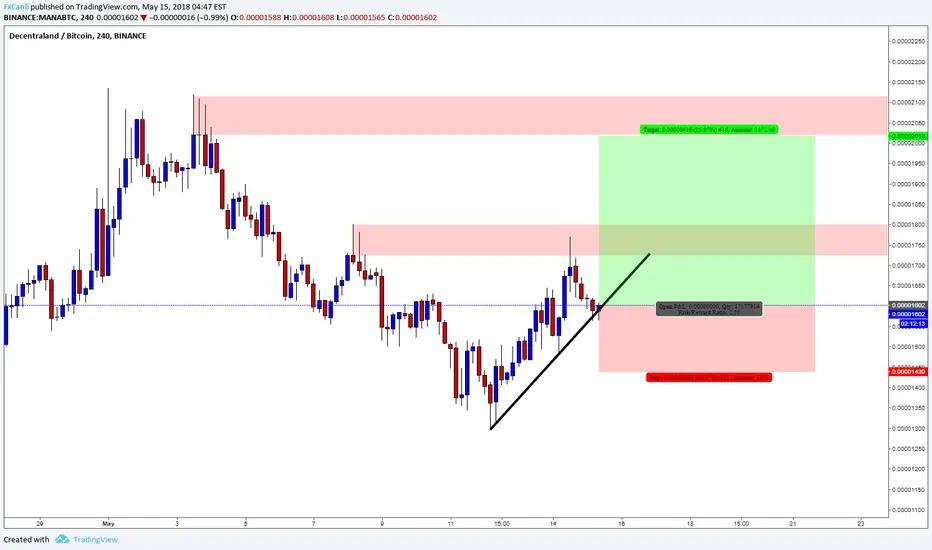
MANABTC / H4 / Support lineMANABTC / H4 / Support line
it try to ove up from Support line,
Resistance zones are on the chart


MANA heading for higher highsYellow circle / Close above or under the MA and EMA
Blue Box / Buy in zone
Red Box / Support / Stop loss
Green Box / Targets we are want to achieve!

MANABTC a quick longThe play. Multiple areas giving us confluence. Looking bullish, a possibility for a few days. Take caution of a sell off at 2100.
Hold or get back in near 2000 for the last final at 2400.
Only my analysis and idea, not a recommendation to trade. Way up your own risks. Play it safe :)

MANA Long Playlooking for another leg up. Looks solid support off fib line. Looking to go up. Good R/R.


MANA Decentraland Cup and HandleCup and handle forming for MANA on Binanace. Lets see what happens. Do not 90% of my predictions fails :D
Doing all of this just for fun :)))

MANA looking to pop? 4 Hour chartHello hello! Took a quick gander at this one. I have a feeling way be seeing a false mini bear flag on the 30 minute. I'll be looking for a strong bounce off the noted .382 fib line for a possible breakout of the larger pennant. Potential for a 40-50% gain! Volume looks weak, but if you look at the 30, it's beginning to rise. I would like a little more confirmation from the MACD and volume first. Not entering quite yet.
ROOKIE trader; Follow at your own risk!
-Solid horizontal orange line: I bought at that price
-Dotted horizontal orange line: mock buy, not in the trade yet
-Solid horizontal pink line: Stop loss/sell implemented
-Dotted horizontal pink lines: Targets

Precision fomosome high r/r trades, eos is ridiculously strong compared to the rest of the market, bcash has roger buying everything forever and bitmain will never sell, don't get chopped on monero it WILL make ATH eventually, MANA should see a retrace to highs after the buyup, gl


MANA pre-pump signal 320% gainLast buy signal using Bottom Finder script was a pre-pump signal generated yesterday at price 124. Then coin was pumped up to 400 today. Potential gain 320%.


MANABTC 4H BounceMANABTC bounced out of a longterm support zone on the 4h timeframe. Could be heading higher, but the volume needs to pick up to confirm the bounce.
