MANA - more upside is expectedpossible wave playout, chart looks like there is strong support for more upwards movement.
MANABTC trade ideas

MANA heading for higher highsYellow circle / Close above or under the MA and EMA
Blue Box / Buy in zone
Red Box / Support / Stop loss
Green Box / Targets we are want to achieve!

MANABTC - Analysis There are two scenarios that can be explained in this 15 min chart:
1 - MANABTC chart, in the last couple of days, showed a resistance to a MA200, as you see on the chart (Red Circles).
That can be a sign that the trend will continue going sideways or hypothetically it might bounce up.
2- On the other hand, MANABTC shows a TRIPLE TOP. Also, the stoch chart is not very promising; you can see the lower top and the bottom is almost flat. It might be a Huge Drop in the next few hours!
Despite the fact that BTC price can change the scenario, HODL is apparently may be the best option.

MANABTC a quick longThe play. Multiple areas giving us confluence. Looking bullish, a possibility for a few days. Take caution of a sell off at 2100.
Hold or get back in near 2000 for the last final at 2400.
Only my analysis and idea, not a recommendation to trade. Way up your own risks. Play it safe :)

MANA Long Playlooking for another leg up. Looks solid support off fib line. Looking to go up. Good R/R.


MANA Decentraland Cup and HandleCup and handle forming for MANA on Binanace. Lets see what happens. Do not 90% of my predictions fails :D
Doing all of this just for fun :)))

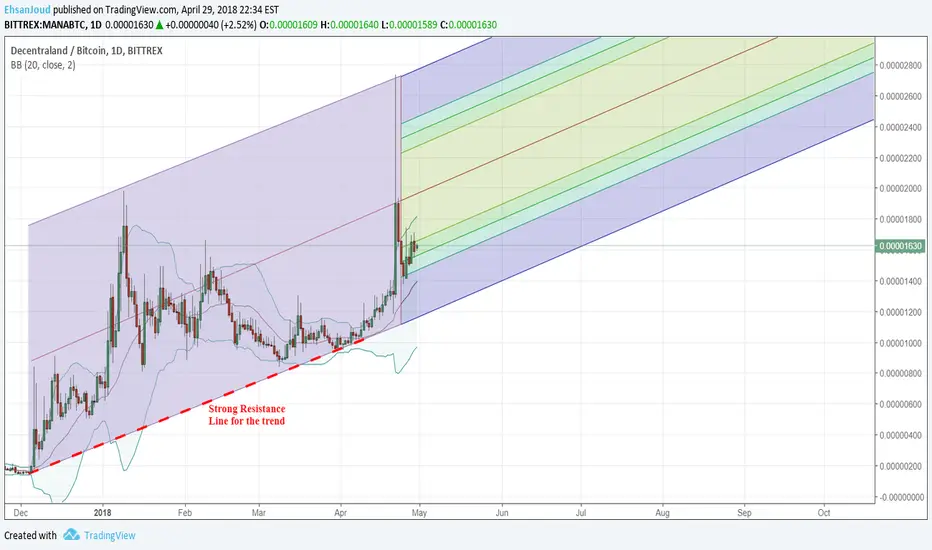
MANABTC - Bullish Trend According to the chart, using Fibonacci trend and BB indicator, MANABTC is right on the parallel trend moving upward. BB indicator, also, is presenting a new potential bullish movement in the short-term.
For a mid term and long term, it probably stays bullish as it is. The only concern is low volume!
MANA looking to pop? 4 Hour chartHello hello! Took a quick gander at this one. I have a feeling way be seeing a false mini bear flag on the 30 minute. I'll be looking for a strong bounce off the noted .382 fib line for a possible breakout of the larger pennant. Potential for a 40-50% gain! Volume looks weak, but if you look at the 30, it's beginning to rise. I would like a little more confirmation from the MACD and volume first. Not entering quite yet.
ROOKIE trader; Follow at your own risk!
-Solid horizontal orange line: I bought at that price
-Dotted horizontal orange line: mock buy, not in the trade yet
-Solid horizontal pink line: Stop loss/sell implemented
-Dotted horizontal pink lines: Targets


Precision fomosome high r/r trades, eos is ridiculously strong compared to the rest of the market, bcash has roger buying everything forever and bitmain will never sell, don't get chopped on monero it WILL make ATH eventually, MANA should see a retrace to highs after the buyup, gl

$MANA - Decentrilized, Maybe?I have not had much luck with this coin. When i see an entry, it seems to fail on me, but I again give it a shot and im making a trade based on the following:
Price above the 10 Period Moving Average
Strong Heikin Ashi Candle and priors showing the start of a bull trend.
Stoch K line turning up. Most should wait for the K line and D line to cross but based on some lower time frames I feel this will happen.
%BB Turning positive, also moving up.
Volume is "ok" lower then the average though in the green, could be better.
I am aiming for 1897 SATS which is about a 6% gain though may change if there is a reversal. My Stop is around 1619, around a 5% loss. Semi risky trade as the volume is kind of low, though this could always spike in either direction.


MANA pre-pump signal 320% gainLast buy signal using Bottom Finder script was a pre-pump signal generated yesterday at price 124. Then coin was pumped up to 400 today. Potential gain 320%.

Preparing for the 5th waveI have a crush on mana, I did my first buy around (2)
Ride the waves and made some nice money on her.
For the final wave, i filled my bags, but i do have some spare btc to enlarge my position if she dips more.
This is my personal trade.


MANABTC 4H BounceMANABTC bounced out of a longterm support zone on the 4h timeframe. Could be heading higher, but the volume needs to pick up to confirm the bounce.


sell manaI reckon we will see a drop in a few alt coins soon, despite seeing bitcoin in limbo on wether it is going up or down.
mana volume is low and stoch rsi is up. if volume does increase i reckon we will see it move down, perhaps not to far down unless we see BTC drop heavily
