MANA , TIME TO CONSIDERSeems iHS is in play on daily time frame , with DNT & CVC Pumps i think mana will join the party soon.
MANABTC trade ideas

MANA is ready to breakout these resistancesMANA is making a push to break a 4H resistance and then a 1D resistance. The pump is not over. MANA found some kind of support and is ready to go back up.


MANA is ready to set new all time highHey friends, hope you are well and welcome to the new update on Decentraland token.
In my previous article, we have seen that the MANA was moving in a down channel and I predicted that this time it will break out the channel.
Now if we take a look at the live daily chat, then finally MANA has broken out the channel and also broke out 25, 50, and, 100 simple moving averages. Now it is stuck at 200 SMA. If the price action of Decentraland will not be able to break out the 200 simple moving average then it may re-test the resistance of the channel as support.
Long-term SMAs:
On the long-term weekly chart, the price action of Decentraland is trying to break out the 25, 50, and 100 simple moving averages.
Long-term Ichimoku cloud is bullish now:
On the long-term weekly chart, the price action of the MANA token was moving under the strong bearish Ichimoku cloud. Now the cloud has finally turned bullish, therefore, it is a strong possibility that the price action would breakout this cloud with a powerful bullish divergence.
Big Shark move:
While the Ichimoku cloud has turned bullish the price action of the MANA token is also moving in a potential reversal zone of a very big bullish Shark pattern on a 2-month chart. When the priceline will start moving up from this potential reversal zone then the price action of MANA my cross the all-time high price level as well.

$MANA, 50% up since monday.. (Buy Signal)$MANA
Following what Alts have been doing over the last week or so..
50% up since monday.. (Buy Signal)
Unfortunatelly I didn't catch this one, but if you did, these are the targets that I'm watching for retests/resistances.
#MANA

Decentraland (MANA) Continues Higher, More Growth After RetraceFollowing up on our chart from Jan 12 for MANABTC (Decentraland), we can expect additional growth:
Now that prices are moving above MA200, we can expect maybe some more growth, followed by a retrace and then additional growth.
This type of bullish action is not just another small jump... We are looking at a potential change of trend... Higher highs and higher lows.
Namaste.

Decentraland (MANA) Is Moving Now... Will It Go Higher?MANABTC (Decentraland) is gaining momentum while I write this.
Just today, we have a very strong bullish candle that took out EMA10 and EMA21 as resistance.
The next challenge is EMA50 or the 0.786 Fib. extension level short-term... If this barrier can be taken out, we can expect strong growth to follow.
Additional details, plus targets, marked on the chart.
Namaste.

MANA Breakout? MANA is very close to breaking out of this major resistance. Good opportunity to buy!

MANABTC completed a big bullish SetupHey friends, hope you are well, and welcome to the new update on Decentraland (MANA) token.
Down channel and EMAs:
On the daily time period char, the priceline of MANA is moving in a down channel. To break out the resistance we need the EMA 10 to cross up the exponential moving average 21.
Ichimoku cloud:
On the long-term weekly chart, the price action of MANA had a very strong resistance of Ichimoku bearish cloud, now the cloud has turned bullish. Therefore now it can breakout the cloud easily.
This move can be like Ethereum when the price action of ETH found weak resistance of Ichimoku cloud on the weekly chart, then it broke out this cloud with powerful bullish divergence.
Gartley move:
On the daily chart, the priceline of MANA has formed a Gartley pattern and entered the potential reversal zone. The 25 simple moving average is moving down to cross down the candlesticks and it can lift the price action soon. Then 50, 100 and 200 SMAs can also cross down the priceline of MANA.
Shark move:
In the long term the price action of MANA has also formed another harmonic Shark move and moving in the potential reversal zone. Soon it can start a very powerful bullish divergence from this level.
Conclusion:
From small to long-term the priceline of MANA is turning bullish. Once the channel on the weekly chart will be broken out then the priceline may start a powerful bull run soon.
For exact buy and sell targets for this trade, and other harmonic trading signals you can join:
www.patreon.com

#MANA Educational Analysis, Buy Only if it breaks downtrend LineMANA is in a long downtrend and rejected many times from the downtrend resistance line. MANA has shown a minor uptrend and if holds the uptrend support line we see more upward moment. MANA must break 295 and hold that level for the further upward moment. If unable to hold above 295 we see MANA going sub 250. The coin is now at the deciding zone, let's see what happens next. A breakout will open the targets and we see a quick push towards 500-600. The post is just for educational purpose

MANABTC formed Gartley | Upto 45.5% expectedHi friends hope you are well, and welcome to the new update on Decentraland (MANA) token.
On daily time period chart, the price action of the MANA with Bitcoin pair has completed the final leg of bullish Gartley and entered in the potential reversal zone.
For exact buy and sell targets for this trade, and other harmonic trading signals you can join:
www.patreon.com

Decentraland LongBased of the previous higher high trend, I'm Predicting MANA will be longterm.
-Price is resting above 50 ma On 4 Hour
-Rejections in fib gold zone On Higher Timeframes.
-Uptrend On 4 hour and Daily


mana bullish on btc and usd pair, accumulation phase almost ovr?if it can break out of this wedge on the btc pair it is confirmed bullish

Crypto|MANA/BTC|LongLong MANA/BTC
1. The beginning of a decline in the level of BTC dominance.
2. Weakening of the growth dynamics of BTC / USD near the ATH.
3. General consolidation of altcoins after a downtrend (to BTC ).
4. Inflow and redistribution of new money in the market.
5. General growth trend of the crypto market.
6. Formation of local trend support, in case of its breakdown into the red zone, you can consider the possibility of early closing of the transaction before reaching the consolidation at the stop level.
The take level is 0,00000524.
The risk-stop level is fixed at 0,00000415.

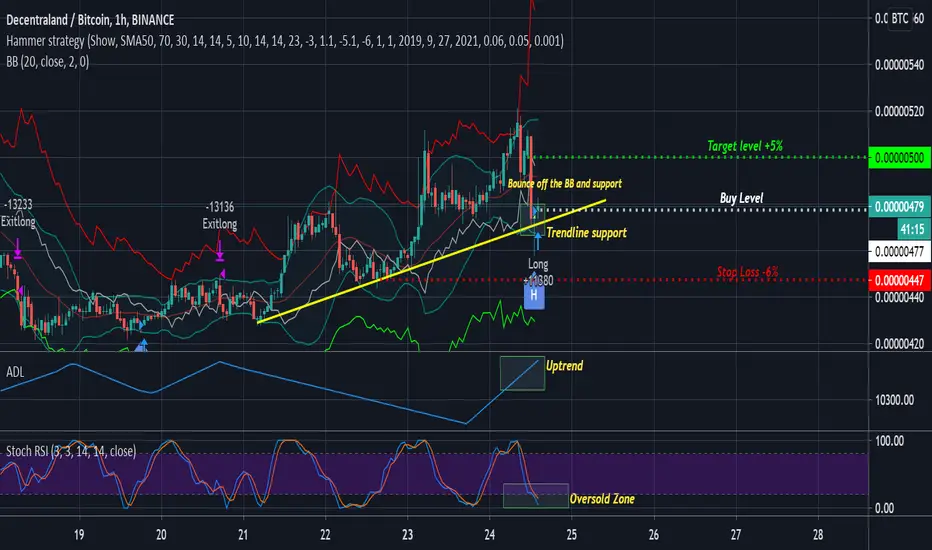
MANABTC Intraday Hammer Trading Hello, dear subscribers!
The Automatic Hammer Strategy revealed the potential trend reverse from the downtrend to uptrend.
The MANABTC price is on the strong uptrend support. We can see that the price bounced off this line and the Bollinger lower band. The ADL line value is in the uptrend, it means the bullish advantage against bearish traders. And finally, the MANABTC is in the oversold zone according to Stoch RSI Indicator.
We expect the 5% price growth from 0.00000477 to 0.000005. The alert was automatically executed by SkyRock Signals trading bot.

MANA/BTC Hidden Bullish Divergence Hidden bullish divergence with a higher low. Waiting to push through resistance. If this happens I expect a move to .00000934, 80%+ potential gain.

