Manausdt buy opportunityMANAUSDT is gaining strength with price rebounding toward the bottom trendline and pushing upward. Momentum favors a continued rise toward the $0.65–$0.80 supply zone, a key level that previously triggered strong sell-offs. A successful breakout above this zone could unlock significant bullish momen
Related pairs

MANA - Observation: Will History Repeat Itself? - UPDATEMANA - Observation: Will History Repeat Itself?
Analyzing the weekly chart of MANA, we can see that the price has reacted sharply around key levels.
Since December 2022, MANA has been moving within a broad trading range, fluctuating between 0.2200 and 0.8200.
Looking at past price movements, MAN

possible double bottom with higher lowlooking for a 1day time frame bearish breaker block. looking to enter in a bullish fvg after breaker if we get one may have to zoom into a smaller timeframe to nail entry.
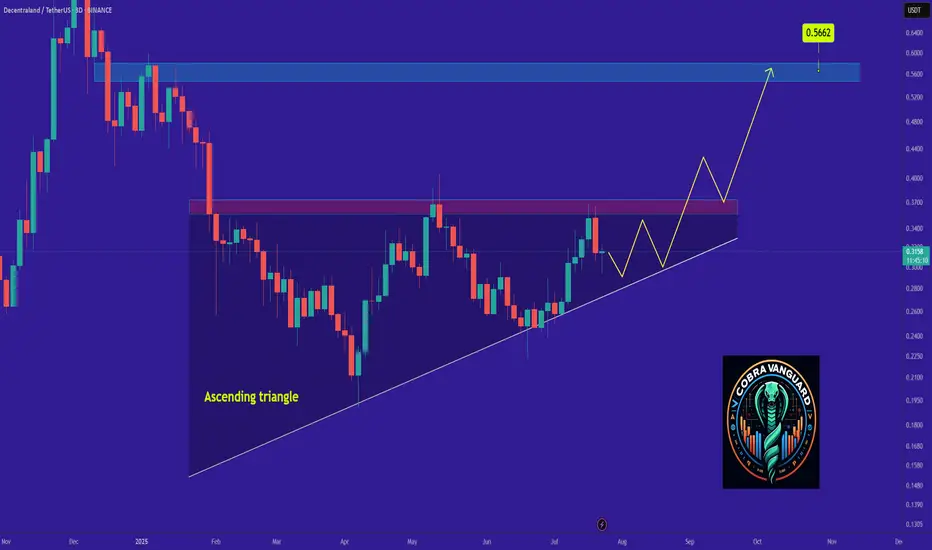
MANA's Situation, A Comprehensive Analysis !!!The price on the 3-d timeframe is within an ascending triangle, which can be promising. If the price breaks this pattern with bullish candles, it could easily rise by the distance of AB=CD .
Best regards CobraVanguard.💚
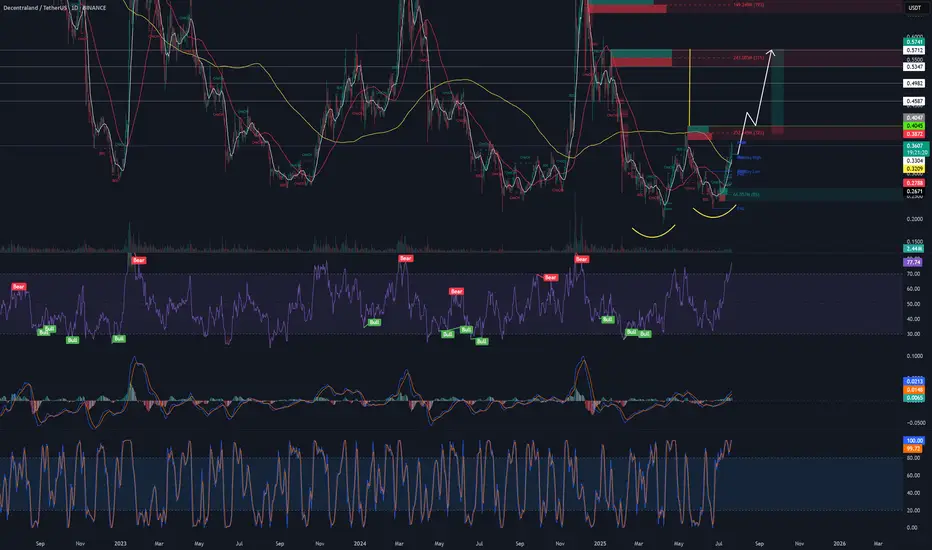
MANAUSDT – Long-term Spot Buy RecommendationMANAUSDT – Long-term Spot Buy Recommendation
Context: MANAUSDT has undergone an extended bottoming process across both the Monthly (M) and Weekly (W) timeframes. The downtrend momentum is exhausted, and a major uptrend wave on W and M is about to begin.
Trade Type: Long-term Spot Investment
E

ManaDecentraland token
Mana usdt Daily analysis
Time frame daily
Risk rewards ratio =2 👈👌
Target = 0439 $
0.44$ - 0.46$ is strong resistance for mana
If price can break this resistance it will go to 0.6$

MANA - move in support and then shoot at 150%Price Prediction:
Short Term (1-3 Days):
The price may continue to move within the falling wedge, maintaining a downward trajectory. However, there is a high probability of testing the lower boundary of the wedge ($0.1900 USDT).
If the price holds above $0.1900 USDT, this could signal a corrective r

Manausdt
"Given the weekly timeframe and the trend change from bearish to ranging, it is expected that the MANA token will move from this green zone toward its first target, namely TP1."

Manausdt
"Given the weekly timeframe and the trend change from bearish to ranging, it is expected that the MANA token will move from this green zone toward its first target, namely TP1."

MANA/USDT Rebounding from Key Weekly Demand Zone – Path to $1?🔶 Strong Support Zone (Demand Zone):
MANA/USDT is currently testing a major weekly support area between $0.20 – $0.30, a zone that has historically acted as a strong demand level since 2021. Price has bounced off this region multiple times, indicating strong buyer interest and potential for a bulli

See all ideas
Summarizing what the indicators are suggesting.
Oscillators
Neutral
SellBuy
Strong sellStrong buy
Strong sellSellNeutralBuyStrong buy
Oscillators
Neutral
SellBuy
Strong sellStrong buy
Strong sellSellNeutralBuyStrong buy
Summary
Neutral
SellBuy
Strong sellStrong buy
Strong sellSellNeutralBuyStrong buy
Summary
Neutral
SellBuy
Strong sellStrong buy
Strong sellSellNeutralBuyStrong buy
Summary
Neutral
SellBuy
Strong sellStrong buy
Strong sellSellNeutralBuyStrong buy
Moving Averages
Neutral
SellBuy
Strong sellStrong buy
Strong sellSellNeutralBuyStrong buy
Moving Averages
Neutral
SellBuy
Strong sellStrong buy
Strong sellSellNeutralBuyStrong buy
Displays a symbol's price movements over previous years to identify recurring trends.
Frequently Asked Questions
The current price of Decentraland / TetherUS (MANA) is 0.3190 USDT — it has fallen −0.06% in the past 24 hours. Try placing this info into the context by checking out what coins are also gaining and losing at the moment and seeing MANA price chart.
Decentraland / TetherUS price has fallen by −3.76% over the last week, its month performance shows a 23.68% increase, and as for the last year, Decentraland / TetherUS has decreased by −0.59%. See more dynamics on MANA price chart.
Keep track of coins' changes with our Crypto Coins Heatmap.
Keep track of coins' changes with our Crypto Coins Heatmap.
Decentraland / TetherUS (MANA) reached its highest price on Nov 25, 2021 — it amounted to 5.9000 USDT. Find more insights on the MANA price chart.
See the list of crypto gainers and choose what best fits your strategy.
See the list of crypto gainers and choose what best fits your strategy.
Decentraland / TetherUS (MANA) reached the lowest price of 0.0300 USDT on Sep 10, 2020. View more Decentraland / TetherUS dynamics on the price chart.
See the list of crypto losers to find unexpected opportunities.
See the list of crypto losers to find unexpected opportunities.
The safest choice when buying MANA is to go to a well-known crypto exchange. Some of the popular names are Binance, Coinbase, Kraken. But you'll have to find a reliable broker and create an account first. You can trade MANA right from TradingView charts — just choose a broker and connect to your account.
Crypto markets are famous for their volatility, so one should study all the available stats before adding crypto assets to their portfolio. Very often it's technical analysis that comes in handy. We prepared technical ratings for Decentraland / TetherUS (MANA): today its technical analysis shows the buy signal, and according to the 1 week rating MANA shows the sell signal. And you'd better dig deeper and study 1 month rating too — it's sell. Find inspiration in Decentraland / TetherUS trading ideas and keep track of what's moving crypto markets with our crypto news feed.
Decentraland / TetherUS (MANA) is just as reliable as any other crypto asset — this corner of the world market is highly volatile. Today, for instance, Decentraland / TetherUS is estimated as 2.14% volatile. The only thing it means is that you must prepare and examine all available information before making a decision. And if you're not sure about Decentraland / TetherUS, you can find more inspiration in our curated watchlists.
You can discuss Decentraland / TetherUS (MANA) with other users in our public chats, Minds or in the comments to Ideas.