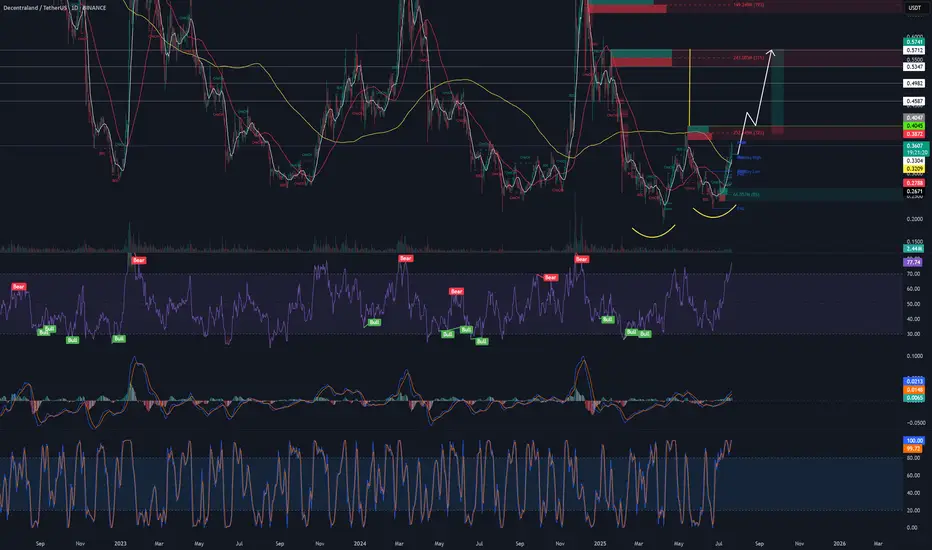
Manausdt buy opportunityMANAUSDT is gaining strength with price rebounding toward the bottom trendline and pushing upward. Momentum favors a continued rise toward the $0.65–$0.80 supply zone, a key level that previously triggered strong sell-offs. A successful breakout above this zone could unlock significant bullish momentum, with eyes set on the $2.70 region as the final setup target. Let price action lead, this could unfold swiftly.
MANAUSDT trade ideas

MANAUSDT – Long-term Spot Buy RecommendationMANAUSDT – Long-term Spot Buy Recommendation
Context: MANAUSDT has undergone an extended bottoming process across both the Monthly (M) and Weekly (W) timeframes. The downtrend momentum is exhausted, and a major uptrend wave on W and M is about to begin.
Trade Type: Long-term Spot Investment
Entry: Around $0.32 — price is already low, no need to bargain further.
Profit-taking Strategy: Sell progressively based on W and M peaks.
+ Real-time monitoring: close partial positions as the market forms new highs.
+ Fixed price targets are merely reference points, not definitive future predictions.
Action: Accumulate MANA spot now and stay prepared for the upcoming long-term rally.

possible double bottom with higher lowlooking for a 1day time frame bearish breaker block. looking to enter in a bullish fvg after breaker if we get one may have to zoom into a smaller timeframe to nail entry.
MANA - move in support and then shoot at 150%Price Prediction:
Short Term (1-3 Days):
The price may continue to move within the falling wedge, maintaining a downward trajectory. However, there is a high probability of testing the lower boundary of the wedge ($0.1900 USDT).
If the price holds above $0.1900 USDT, this could signal a corrective rally toward the $0.2750 USDT level.
Medium Term (1-2 Weeks):
If the price successfully tests the lower boundary of the wedge and rebounds upward, this could lead to a reversal of the pattern and the start of an uptrend.
The target levels after a wedge breakout would be $0.3863 USDT (previous local high).
In case of an unsuccessful test of support ($0.1889 USDT), the price may continue to decline toward deeper support levels (e.g., $0.1500 USDT).
Long Term (1 Month+):
If there is a successful reversal of the falling wedge pattern, this could mark the beginning of a sustained recovery. Target levels could extend beyond $0.3863 USDT, such as $0.5000 USDT or higher.
However, if the downtrend continues without reversal, long-term targets could be significantly below current levels.
Trading Recommendations:
Long (Buy):
Entry: After a successful test of the lower boundary of the wedge ($0.1900 USDT) and a subsequent bounce upward.
Take-Profit: $0.2750 USDT → $0.3863 USDT → $0.5000 USDT.
Stop-Loss: Below $0.1889 USDT (to protect against further declines).
Short (Sell):
Entry: If the price fails to break above the upper boundary of the wedge ($0.2750 USDT) and begins to decline.
Take-Profit: $0.1900 USDT → $0.1500 USDT.
Stop-Loss: Above $0.2750 USDT (to protect against a bullish reversal).
Conclusion:
At the moment, the asset MANA is in a downtrend, forming a falling wedge. This creates potential for both a corrective rally and a continuation of the decline. The key event will be the test of the lower boundary of the wedge ($0.1900 USDT). A successful test could lead to a reversal of the pattern and the start of an uptrend, while an unsuccessful test could strengthen the downtrend.

Manausdt
"Given the weekly timeframe and the trend change from bearish to ranging, it is expected that the MANA token will move from this green zone toward its first target, namely TP1."

Manausdt
"Given the weekly timeframe and the trend change from bearish to ranging, it is expected that the MANA token will move from this green zone toward its first target, namely TP1."

MANA/USDT Rebounding from Key Weekly Demand Zone – Path to $1?🔶 Strong Support Zone (Demand Zone):
MANA/USDT is currently testing a major weekly support area between $0.20 – $0.30, a zone that has historically acted as a strong demand level since 2021. Price has bounced off this region multiple times, indicating strong buyer interest and potential for a bullish reversal.
🔶 Chart Pattern:
There is no classic pattern like a double bottom or head & shoulders, but price structure shows signs of horizontal accumulation, which resembles a Wyckoff re-accumulation phase—a typical base formation before a strong upside breakout.
🚀 Bullish Scenario:
If the price holds above the $0.25 support and forms a higher low, a bullish continuation is likely. The following resistance levels could serve as potential upside targets:
1. $0.3610 – Initial resistance and confirmation level.
2. $0.5475 – Intermediate psychological level.
3. $0.8109 – Former supply zone.
4. $1.0661 – Major resistance from 2022.
5. $2.7291 – $5.0666 – Long-term targets if macro bull trend resumes.
> Bullish Confirmation: A strong weekly candle close above $0.36 with high volume could spark a major rally.
🔻 Bearish Scenario:
If price breaks down below $0.25 and closes below it on the weekly timeframe, it would invalidate the bullish structure and may trigger further downside towards:
$0.13 – $0.07, the historical lows seen in early 2021.
> Bearish Confirmation: A weekly close below $0.25 with increasing volume would suggest sellers are back in control.
🧠 Conclusion:
MANA/USDT is at a pivotal point within a long-standing support zone. Holding this level could result in a strong upward move, but a breakdown would indicate further bearish pressure. Traders should watch this zone closely for confirmation in either direction.
#MANAUSDT #Decentraland #CryptoTrading #TechnicalAnalysis #AltcoinAnalysis #BullishSetup #SupportZone #TradingView #MetaverseCrypto #CryptoBreakout

$MANA Trading SignalKey Zones: Clear supply zone above and demand zone below the current price.
Fair Value Gaps (FVGs):
3 FVGs on the 4H timeframe below the current price.
2 FVGs on the 1H timeframe above the current price.
Trend & Indicators:
Market structure remains bullish.
OBV is forming a rising wedge, indicating potential momentum exhaustion.
Anchored volume profile shows high volume concentration below the current price, suggesting strong support.
Trade Plan:
Scalp Setup: Based on the smaller Fibonacci retracement tool, with a target at the previous swing high. Risk-to-reward (R:R) is approximately 1:1.
Swing Setup: Entry between the two 4H FVGs around 0.2874, targeting the psychological levels above. Stop loss set below the most recent swing low.

MANAUSDT 1W AnalysisMANA ~ 1W Analysis
#MANA Buy back gradually from this support block with a short term target of at least 20%+ from this support.

MANAUSDT 1D AnalysisMANA ~ 1D Analysis
#MANA Buy gradually from here if you still have confidence in this coin with a short term target of at least 15%++ from here.

#MANAUSDT (yellow pattern )At the bottom of the chart we see the yellow pattern,
its top has stopped growth three times and its bottom has stopped decline four times.
So exiting from the top of this pattern will be very interesting.
A stable break of the bottom of the pattern can also be a short position

ManaDecentraland token
Mana usdt Daily analysis
Time frame daily
Risk rewards ratio =2 👈👌
Target = 0439 $
0.44$ - 0.46$ is strong resistance for mana
If price can break this resistance it will go to 0.6$

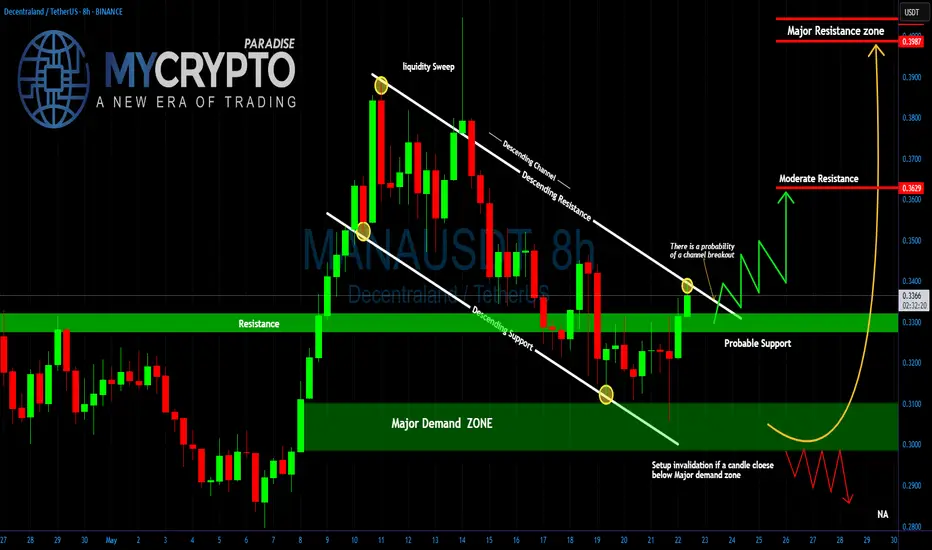
Is MANA About to Break Out?Are You Ready for It?Yello Paradisers, can you feel the calm before the storm? MANAUSDT is quietly setting up for what could become a major breakout move and most traders won’t see it coming until it’s already too late. That’s exactly the kind of opportunity we love to prepare for in advance.
💎#MANAUSDT has been consolidating inside a clearly defined descending channel, marked by consistent lower highs and lower lows since its liquidity sweep above $0.39. This cooling-off phase has allowed the market to reset after that aggressive move, but now, the structure is starting to shift.
💎What’s important here is the price action around the horizontal resistance-turned-support level near $0.33. Price is currently hovering just above this zone, and early signs of a breakout are beginning to show. A clean candle close above the descending resistance of the channel will be the confirmation signal that many smart traders are waiting for and it could set off a wave of FOMO driven momentum.
💎Below the structure, we see a well-defined major demand zone between $0.2950 and $0.3100. This is where buyers stepped in aggressively after the channel lows were tested. As long as price stays above this zone, the bullish setup remains valid. However, if we get a confirmed candle close below that demand zone, the entire structure becomes invalidated, and further downside becomes likely.
It’s not about catching every move it’s about catching the right ones with proper validation and risk control. Trade smart, Paradisers.
MyCryptoParadise
iFeel the success🌴
MANAAdded to my watchlist. Ideally I`ll be waiting retest and looking for LONG position.
But if we start moving from this level or closest support still there is a good entry in my opinion.
NFA - DYOR

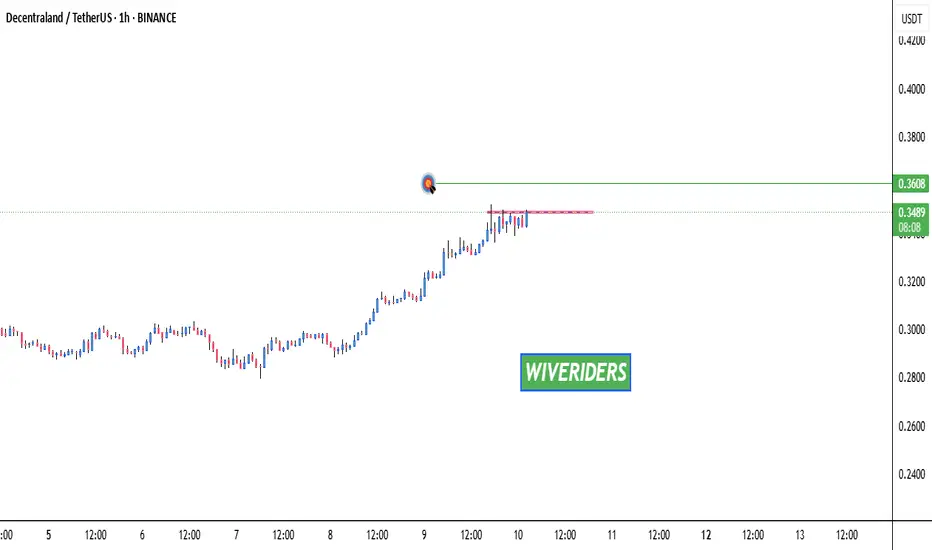
MANA Testing Red Resistance🚀 OTC:MANA Testing Red Resistance – Target Ahead! 📈
OTC:MANA is currently testing the red resistance zone. If the price breaks through, the target could be the green line level! 📊
Let’s watch this breakout together! 💼💸
MANA Weekly AnalysisMANA Weekly Analysis
MANA is showing a positive divergence on the weekly timeframe.
This coin has the potential to rise toward the marked resistance levels.
It’s recommended to take profit at the first resistance level.
For added caution, you can rely on the lowest support zone as a safer stop level.
Potential growth and pullback percentages are shown on the chart.
Follow us and support us with your energy!

Decentraland: Your Altcoins Choice (S5)I looked at MANA (Decentraland) recently, two weeks back, and the chart is the same but with the bullish reversal now confirmed.
MANAUSDT produced a major low last month and now is full green. This is the fourth week with growing prices and a bullish bias. A clear recovery. This recovery will lead to a major bullish wave.
The recent low activated the lowest prices since February 2021 and this support level back in 2021 launched the fifth wave of the last bull market. In April 2025, this same level marks the start of the current bullish cycle. We are set to experience maximum growth so lets focus on the targets.
» A very easy target can be found at $1.93 with 505% profits potential. This is a strong target with a very high probability to be hit within the next 3-6 months. A strong target sits at $3.75 and gives 1,076% profits potential or more than 11X.
» Short-term, there is a target at $0.6017 for 88% and this is just too easy, it should be ignored. Aim higher.
If this bull market becomes a really strong one, which I believe will be the case, MANAUSDT can move to hit a new All-Time High. An ATH for 2025 can be $6 just as it can be $9.37. The latter gives 2,837% profits potential or almost 30X from current prices.
This is a good project and has done great in the past. Timing is good now if you focus on the long-term.
The low is in. The correction is over. The bottom is in, higher highs and higher lows next.
A bullish cycle.
Thanks a lot for your continued support.
Namaste.

MANAUSDT 1D AnalysisMANA ~ 1D Analysis
#MANA Buy gradually when re -testing this support with a short -term target of at least 15%+ from here.
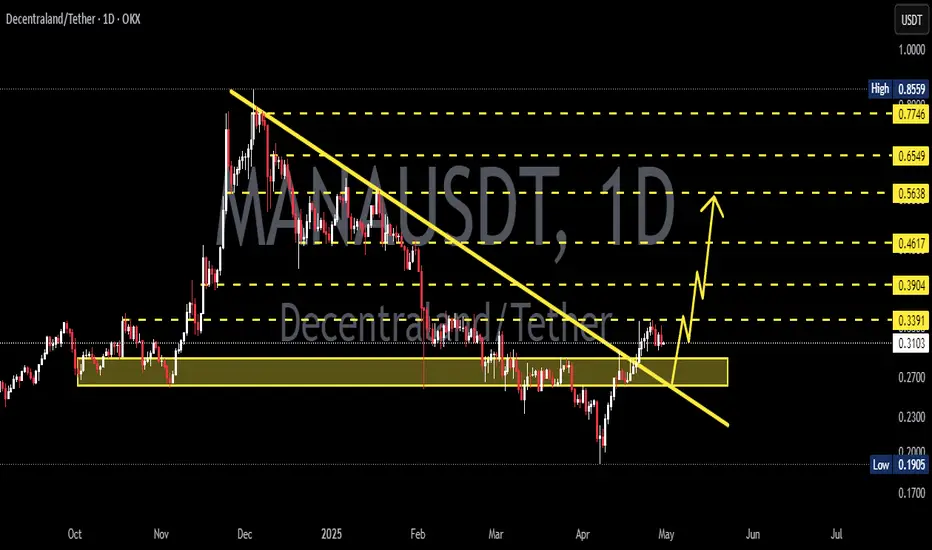
MANAUSDT Huge Bounce Incoming?MANA is currently testing a long-term descending support trendline on the weekly chart. This level has acted as a reliable bounce zone multiple times in the past (highlighted with arrows).
-Price is holding above a major support level (~$0.21), showing signs of demand.
-Weekly RSI is forming a bullish divergence, with higher lows on RSI vs. lower lows on price — often a precursor to trend reversals.
-Previous touches on this trendline have led to significant rallies.

MANA at a Crucial Support | Bullish Reversal in Play?Hey traders!
#MANA is currently testing a strong historical support zone and has shown signs of a bullish bounce, holding above key levels. This could be the beginning of a trend reversal if momentum continues.
Technical Highlights:
Strong support holding firm
Bullish wick rejections near support
Watching closely for a break above the entry/resistance level for confirmation
Trade Idea: We're waiting for a clean breakout above the resistance to confirm the bullish trend. Once we get that, it's a green light for a long trade setup — with tight risk management of course!
Key Levels:
Support: 0.1820
Resistance/Entry Zone: 0.3050
Risk Management Tip:
Never chase the market. Let the price come to you and confirm the setup.
Drop your thoughts in the comments:
Are you bullish on #MANA?
What’s your target for the next move?
Follow for more real-time setups, chart breakdowns, and trade ideas!
#MANA #CryptoTrading #Altcoins #TechnicalAnalysis #TradingView #CryptoSetup #BullishBreakout #RiskManagement #ChartPatterns #SupportAndResistance

Conspicuous - MANA / USDTEvening fellow traders,
Every now and then I ride waves on MANA.
This time it won't be different, as I am already in it.
But I'm looking for an extra touch, that outta the box type thing and buying an extra chunk between the prices shown in the chart.
Please take advantage of this if you get the chance, and let's make a big chunk of money together!
Trade thirsty, my friends!

TradeCityPro | MANAUSDT Fake Breakout Trigger Activated!👋 Welcome to TradeCityPro Channel!
Let’s dive into the analysis of one of the metaverse coins and quickly check the trigger and the action unfolding on its chart together!
🌐 Overview Bitcoin
Before starting the analysis, I want to remind you again that we moved the Bitcoin analysis section from the analysis section to a separate analysis at your request, so that we can discuss the status of Bitcoin in more detail every day and analyze its charts and dominances together.
This is the general analysis of Bitcoin dominance, which we promised you in the analysis to analyze separately and analyze it for you in longer time frames.
📊 Weekly Timeframe
On the weekly timeframe, MANA is one of those coins still oscillating within its range box. After a rejection from the key ceiling at 0.7679, we moved back toward the lower end and continued to fluctuate within our range box.
The candle from two weeks ago attempted to close below the critical support at 0.2484—and it did close below this box’s floor. However, this didn’t trigger a sharp drop; instead, we saw a fake breakout!
A fake breakout occurs when a support or resistance level is breached, but the next candle reverses back above the support or below the resistance. This is often called a fake breakout, and it typically signals a trend reversal or the start of a new trend.
That’s exactly what happened here. After the break, the next candle closed as a strong green candle, returning MANA to its box. This could mark the start of a new trend. You can take this trigger with a stop loss at 0.1722 and capitalize on the potential move!
📉 Daily Timeframe
In the daily timeframe, MANA has continued to show the aftermath of the fake breakout. After the failed attempt to break below 0.2484, the price quickly recovered, with buyers stepping in to push it back into the range box.
The strong green candle that followed the fake breakout confirms the buying pressure, and the price is now testing the upper boundaries of the box. If we see a break above 0.7679, it could signal a strong bullish move. However, caution is needed—failure to break this resistance could lead to another rejection.
For buying, the fake breakout trigger at 0.2484 is active, and you can enter with a stop loss at 0.1722. Confirmation would come from sustained volume and a push above the 50-day moving average. For selling, if we break below 0.1722, it’s a sign to exit, as the downtrend could resume.
✍️ Final Thoughts
Stay level-headed, trade with precision, and let’s capitalize on the market’s top opportunities!
This is our analysis, not financial advice always do your own research.
What do you think? Share your ideas below and pass this along to friends! ❤️

Decentraland to Skyrocket 6000% in 2025? Explosive Potential...On the above 4-day chart price action has corrected 96% since November 2021.
A recession is coming, everyone is talking about it… that can only mean one thing, sellers are ready drop the price action the remaining 4% to $0
But what if…. What if price action prints a 6000% upward move instead?
Based on the technical chart for MANA/USDT (where the volume is at), we're seeing a compelling bull flag pattern with strong confirmation signals. Price action is currently testing the lower boundary of a multi-year descending channel, with the RSI oscillator showing significant positive divergence—a classic signal that downward momentum may be weakening despite continued price declines.
What makes this setup particularly interesting is the historical context on positive divergence. The divergence is measured over 24 days. For those of you that follow my work elsewhere you’ll recognise the significance of this period with stochastic RSI rotation.
Looking left, the 6000% forecast is a repeat of the impulsive move of 2021, which would take price action to circa $10 to $11. This forecast is also matched by the Fibonacci 1.272 level, which is interesting on its own for a reason I’ll explain elsewhere.
Is it possible sellers keep on selling the remaining 4% to 0, sure… sellers today are driven by fear and News.
Is it probable? No.
Ww
PS: No further public updates on this idea until August.
