MANAUSDT Bullish Move?MANAUSDT has given us an entry signal with some bullish signals and our price targets with SL are in place.
MANAUSDT trade ideas

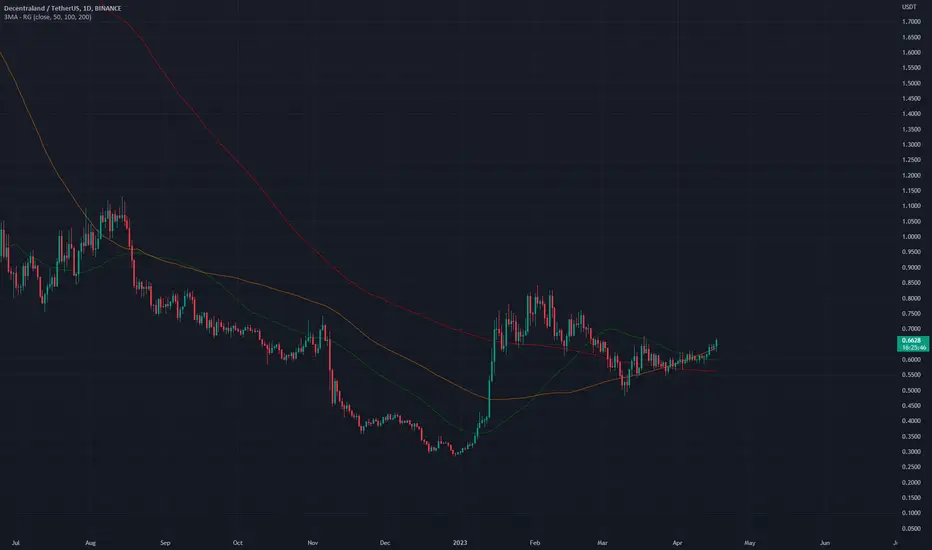
MANA - Key resistance broken
A solid bullish candle has ripped through 0.64 resistance, and I expect a new higher high above 0.8427.
My invalidation point (or SL if you plan to trade this) is 0.5440.
I'll take a trade if we get a pullback back to gray zone, former resistance, now support.

MANAUSD - Plotting Future MovesA down channel can be drawn on MANA like this
The Middle line shows a nice bullish touch however on this middle line which is a sign for bulls, I expect alts to be very volatile hence the price action plotted in green.
Its kind of a head and shoulders pattern on the side if you look at it closer, linking a comparison to the H&S below

MANA short setup trade 4hr TFMana on a daily time frame is targeting up 40%
But currently in 4hr tf there is.a small correction trade that we can take in shark pattern
Short entry mentioned in chart SL mentioned
Targeta in fibo .
Good lock

MANA: Channel Down BreakoutDecentraland (MANA) technical analysis:
Trade setup : Price broke out of trading in a Channel Down pattern, which it was consolidating in after substantial gains earlier this year. This bullish breakout from Channel Down and above $0.60 key level and 200-day moving average, could indicate Uptrend resumption with near term potential upside to $0.75.
Pattern : Price was trading in a Channel Down pattern. With complete patterns (i.e. a breakout) – initiate a trade when the price breaks through the channel’s trendlines, either on the upper or lower side. When this happens, the price can move rapidly in the direction of that breakout.
Trend : Uptrend across all time horizons (Short- Medium- and Long-Term).
Momentum is Bullish (MACD Line is above MACD Signal Line and RSI is above 55).
Support and Resistance : Nearest Support Zone is $0.60, then $0.42. The nearest Resistance Zone is $0.75, then $1.00.

Mana 40% gain on the way Mana on a dayly time frame is target Gartley pattern target its a chance for 40%
Suitable for spot trade
Mentain your stop carefully.

MANAUSD Looks Really StrongPrice looks like it is going to breakout off the 100ma on this daily timeframe
Structure makes price breakout look really strong
MANAUSD - Inverted H&SAn addition to my last post supporting the bullish move I posed.
This idea shows an inverted H&S pattern that is slightly tilted.
Right shoulder arm yet to form.

MANA Moving Along 100MAPrice seemingly is stuck to the 100MA
This was previously seen in another example earlier
Following this a large breakout ensued
Will we see another breakout above the 100MA ?

✅TS ❕ MANAUSD: fixed above the support✅✅ MANA is moving in an uptrend.
The chart has broken through the resistance area and has fixed above it.
The price will continue to rise. ✅
🚀 BUY scenario: long to 0.666 🚀
----------------------------------------------------------------------------
Remember, there is no place for luck in trading - only strategy!
Thanks for the likes and comments.

RR=3 buy ideaBreakout of trendline with pullback + trend strongly bullish and price is forming a continuation pattern "triangle"
PS never risk more than 2% of your capital per trade

✴️ Decentraland | A Different PerspectiveMANAUSDT Grew by almost 200% in its initial recovery wave, that is January 2023.
This might sound like a lot but when you put this into perspective, it is actually just a tiny bit of the total growth potential... See this chart...
This is only the mid-term and the 6 months "long-term".
We consider long-term within 6 months or 6 months or longer.
When we consider the long long-term (12+ months), then we are looking at new All-Time Highs and the potential is off the chart.
And it looks bullish short-term (main chart).
Namaste.

#MANA Buy Setup #Fast Scalpe Resultresult of mana analys buy setup
to close to Entry and allready got FUll Target aswell

#MANA Buy Setup #Fast ScalpeMana in minor Time Frame got those level for a Reverse up
0.6171 - 0.6113 FTB is important " First TIme Back "
Scalpe Target is : 0.6234
SL : 0.6066

Manausdti am going to long on mana we have seen a break out and retest now market is moving up look at the risk and reward this is an idea do not invest more then you cannot afford to lose go with normal levrage good luck

MANA IS STILL BEARISHHi, dear traders. how are you ? Today we have a viewpoint to SELL/SHORT the MANA symbol.
For risk management, please don't forget stop loss and capital management
When we reach the first target, save some profit and then change the stop to entry
Comment if you have any questions
Thank You

The presence of two similar structures in a technical chart."#manausdt #🟢buy Setup:
Limit Order:
Entry 1:0.6088
Tp 1:0.6764(14% on the chart)
Tp 2:0.8270 (36% on the chart)
Tp 3:1.1212 (85% on the chart)
Stop loss:0.5294 (12% the chart)

MANA | The breakout of a bullish flag !#MANA/USDT
Bulls were able to make a clear break out of the bullish flag pattern !! let's take this opportunity!
🟢Entry price: from now at 0.619 to 0.57
🎯Targets:
|> 0.705
|> 0.845
|> 1.03
🔴Stop-loss: Daily candle closes under 0.56
➡️Recommended risk: 0.25%
➡️Recommended total Positions Size: 3%
-------------------------------
Don't forget to take a look at related ideas section, it has a lot of altcoins trade
LEAVE A LIKE IF YOU FIND THIS WAS USEFUL :)

🔥MANA IS ANOTHER ALTCOIN WHICH WILL BRING THE HUGE PROFIT!🔥 Hi friends! Decentraland (MANA) is one of the most popular Game-Fi projects. I think the long long trade will be very profitable, especially if you will use my preconditions to open a long.
📊 TRADING PLAN FOR MANA:
1. liquidity collection below the $0.58-0.61 value area
2. volume growth
3. bullish BTC
✅ MY TARGETS FOR MANA:
🔥$0.72-0.75 - the value area
🔥$0.84 - the local high
🔥 HKEX:1 - the key level and local high
Write your thought about this altcoin in the comments. What is your targets for MANA?
💻Friends, press the "boost"🚀 button, write comments, and share with your friends - it will be the best THANK YOU.
P.S. Personally, I open an entry if the price shows it according to my strategy.
Always do your analysis before making a trade.

MANA formed Bull Flag PatternMANA formed Bull Flag Pattern
Wait for Breakout/Breakdown and Retest before Short or Long

MANA - Channel BreakoutWe are getting the initial indications that the bearish momentum is fading away, with a break of the descending channel that began in early February.
There is still a major hurdle for bulls at 0.64 resistance. We can also correct some more to the downside to retest the channel top.
Even if perspectives are getting more positive for MANA, there is still no reason to call a long trade.

#MANAUSDT #LQR #TOBTC #LaqiraProtocol In the first analysis, we said that the price after breaking the downtrend after confirmation can grow that about 6% profit then you could enter again after confirmation that about 17% of the other profits have been profitable now in the trading range Support and resistance are clear on the chart you can trade after confirmation this analysis is not a buy or sell offer

MANAUSDT ANALYSIS (4H)Hi, dear traders. how are you ? Today we have a viewpoint to BUY/SELL the MANA symbol.
For risk management, please don't forget stop loss and capital management
When we reach the first target, save some profit and then change the stop to entry
Comment if you have any questions
Thank You
