Decentraland to Skyrocket 6000% in 2025? Explosive Potential...On the above 4-day chart price action has corrected 96% since November 2021.
A recession is coming, everyone is talking about it… that can only mean one thing, sellers are ready drop the price action the remaining 4% to $0
But what if…. What if price action prints a 6000% upward move instead?
Based on the technical chart for MANA/USDT (where the volume is at), we're seeing a compelling bull flag pattern with strong confirmation signals. Price action is currently testing the lower boundary of a multi-year descending channel, with the RSI oscillator showing significant positive divergence—a classic signal that downward momentum may be weakening despite continued price declines.
What makes this setup particularly interesting is the historical context on positive divergence. The divergence is measured over 24 days. For those of you that follow my work elsewhere you’ll recognise the significance of this period with stochastic RSI rotation.
Looking left, the 6000% forecast is a repeat of the impulsive move of 2021, which would take price action to circa $10 to $11. This forecast is also matched by the Fibonacci 1.272 level, which is interesting on its own for a reason I’ll explain elsewhere.
Is it possible sellers keep on selling the remaining 4% to 0, sure… sellers today are driven by fear and News.
Is it probable? No.
Ww
PS: No further public updates on this idea until August.
MANAUSDT trade ideas

MANA Motive Wave
The gray descending trendline has been broken, in what looks to be a motive wave (green I-V).
I will be looking for green IV corrections, ideally retesting the trendline, for long trades.
On the flipside, there is no RSI divergence on the recent low, so the probability that we have seen a bottom is not that big.

Decentraland: Success In 2025 & BeyondRemember the linear chart. When the action goes flat and the candles become very small, sometimes almost invisible, it means that the current sideways period is reaching its end.
After a bear market there is a long-term consolidation phase and then the next bull market. The long-term consolidation phase for Decentraland is reaching its end and we are about to enter the 2025 bull market. Expect maximum growth.
Here is the linear chart, it shows a perspective with which we can easily appreciate the fact that MANAUSDT is trading at bottom prices. Truly bottom, very low. The best time to buy; when prices are low.
Then we can consider the logarithmic chart. Decentraland grew 45,300%+ between 2020 and 2021.
With this little exercise we cleared up two things: (1) bottom prices and (2) huge potential for growth. Cryptocurrency is the best financial market in the world.
So this pair is good and recently pierced the sideways channel which is a strong buy opportunity, but this never last long. The action is back above but it is still early, because the action is happening near support.
The rest is up to you. This is a friendly reminder. Great timing. No complexities, an easy trade. Buy and hold. Wait patiently and then comeback to collect your check.
There is no need to try and catch the market within a bullish wave. When one pair starts moving, there is always one that is yet to grow. Instead of chasing the ones that already broke out, look for the ones that are still to make their first move, buy them and hold. This strategy leads to success. If you chase a pair, it means you have no plan and the moment you buy it drops and this will push you to sell at a loss and find another pair.
Since it takes many months for a full bullish wave to develop, there is no need to buy something just because it is going up today. Since it can take years for prices to grow, just look for the ones that look best, with the highest probability of high gains, low risk.
Plan ahead and if you don't know what to do, just follow me.
If you don't know what to choose, read these charts that I share everyday. There is no need to rush. Once you read daily what I have to say, you will get used to the market and your choice will make itself present.
There are many of us and not everybody should buy the same. What works for you might not work for me and vice versa. That's why time is needed, invest in yourself. When you take the time to read and study, you will know exactly which pair to buy and hold. Take your time, opportunities are endless when it comes to Crypto.
Thanks a lot for your continued support.
Take your time but do not become complacent. Read everything, be prepared.
It is a small price to pay. Dedicate some time to the market and the market will bless you, with profits.
Namaste.

The key is whether it can rise after receiving support at 0.2349
Hello, traders.
If you "Follow", you can always get new information quickly.
Please click "Boost" as well.
Have a nice day today.
-------------------------------------
(MANAUSDT 1D chart)
It receives support near 0.2349
1st: 0.2636
2nd: 0.3136
The key is whether it can rise to the 1st and 2nd above.
An important volume profile section is formed in the 0.1066-0.1547 section.
Therefore, from a mid- to long-term perspective, the 0.1066-0.1547 range can be considered the last buying range.
-
In order to continue the upward trend, the price must be maintained above the M-Signal indicator of the 1M chart.
Therefore, a way to increase the number of coins (tokens) corresponding to profits with peace of mind is needed.
-
MANA coins are used for Collectibles & NFTs, Gaming, Play To Earn, and Payments.
In addition, it belongs to the Ethereum Ecosystem, Solana Ecosystem, Polygon Ecosystem, Gnosis Chain Ecosystem, and Fusion Network Ecosystem.
Therefore, it seems that it can be used in various ways.
I don't think the future outlook is that bad, but since it is currently being used for Gaming, I don't think there is much merit in terms of price.
This is because it is not easy for the Gaming business to continue to develop.
I think the business needs to expand a bit more.
-
(30m chart)
- HA-High indicator rises above,
- Trend Cloud indicator is rising,
- Rising near the M-Signal indicator on the 1D chart,
- StochRSI indicator enters the overbought zone,
Under the above conditions, there is a possibility that support will be confirmed near the HA-High indicator again.
Accordingly, the key is whether it will be supported near 0.2349, which is the M-Signal indicator point on the 1D chart.
It cannot be ruled out that it will rise to around 0.2636, but it is judged that there is not enough trading volume for that to happen.
-
Thank you for reading to the end.
I hope you have a successful trade.
--------------------------------------------------
- This is an explanation of the big picture.
I used TradingView's INDEX chart to check the entire range of BTC.
I rewrote the previous chart to update it by touching the Fibonacci ratio range of 1.902 (101875.70) ~ 2 (106275.10).
(Previous BTCUSD 12M chart)
Looking at the big picture, it seems to have been following a pattern since 2015 and has been rising.
In other words, it is a pattern that maintains a 3-year uptrend and faces a 1-year downtrend.
Accordingly, the uptrend is expected to continue until 2025.
-
(Current BTCUSD 12M chart)
Based on the currently written Fibonacci ratio, it shows up to 3.618 (178910.15).
Fibonacci ratio 0.618 (44234.54) is not expected to fall again.
(BTCUSDT 12M chart)
I think it is around 42283.58 when looking at the BTCUSDT chart.
-
I will explain it again with the BTCUSD chart.
The Fibonacci ratio ranges marked in the light green boxes, 1.902 (101875.70) ~ 2 (106275.10) and 3 (151166.97) ~ 3.14 (157451.83), are expected to be important support and resistance ranges.
In other words, it seems likely to act as a volume profile range.
Therefore, in order to break through this section upward, I think the point to watch is whether it can rise with support near the Fibonacci ratios of 1.618 (89126.41) and 2.618 (134018.28).
Therefore, the maximum rising section in 2025 is expected to be the 3 (151166.97) ~ 3.14 (157451.83) section.
To do that, we need to look at whether it can rise with support near 2.618 (134018.28).
If it falls after the bull market in 2025, we don't know how far it will fall, but considering the previous decline, we expect it to fall by about -60% to -70%.
So, if the decline starts near the Fibonacci ratio 3.14 (157451.83), it seems likely that it will fall to around Fibonacci 0.618 (44234.54).
I will explain more details when the downtrend starts.
------------------------------------------------------

I'm Bullish, but... MANA / USDTHi friends,
My latest post about MANA was bullish, and I did buy some of the blood we just had.
But this would be another coin that could drop 25% - 30% giving a great opportunity.
Keep an eye on BTC cause if it dumps, this will happen.
Trade thirsty!

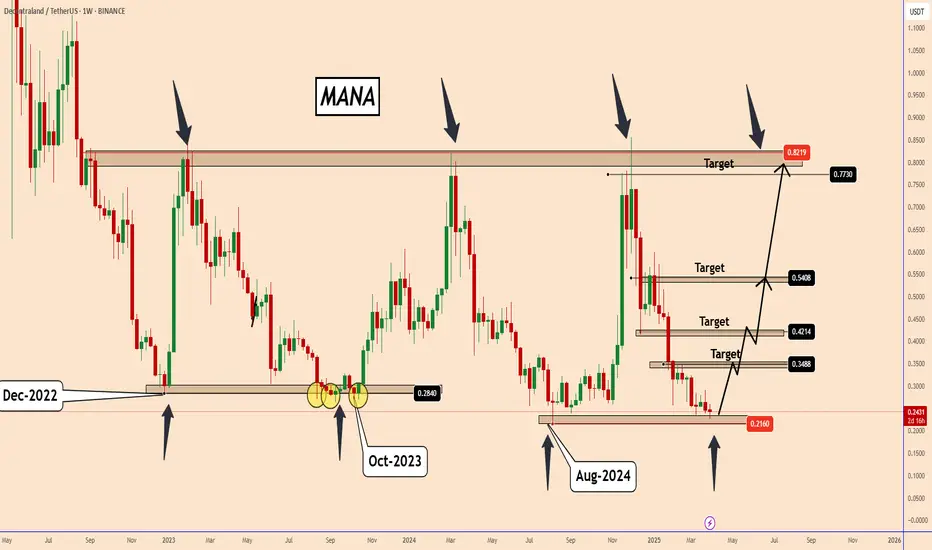
MANA - Observation: Will History Repeat Itself?MANA - Observation: Will History Repeat Itself?
Analyzing the weekly chart of MANA, we can see that the price has reacted sharply around key levels.
Since December 2022, MANA has been moving within a broad trading range, fluctuating between 0.2200 and 0.8200.
Looking at past price movements, MANA rose from 0.2800 in December 2022. When tested again in October 2023, it dipped slightly below this zone before rebounding strongly. A similar pattern emerged in August 2024, where the price dropped just below the October 2023 level, then surged back up to test the upper boundary near 0.8200.
Given this repeating behavior, the chart suggests that the price may follow a similar pattern this time.
You may find more details in the chart!
Thank you and Good Luck!
❤️PS: Please support with a like or comment if you find this analysis useful for your trading day❤️
RR=4 buy ideaPotential reversal scenario : bullish shark pattern + breakout of falling wedge + Bullish RSI divergence , price might reverse and retest previous swing highs
PS : never risk more than 2% of your capital per trade

MANA - PERFECT SIGNAL. OMG! That level was magical.1- I gave a blue box on 16th March and i wrote :
" There are some bullish divergences in Volume in 2h+.
Even daily Volume is really bullish.
We may have missed a Long opportunity. But a Short at those marked Levels are reasonable! "
We were waiting for that level .
That Level gave us really nice 7 Shorts.
2- Original Signal was here 16th March:https://www.tradingview.com/chart/MANAUSDT.P/adttA7xG-MANA-it-looks-bullish-regarding-Volume/
3- Days Later these nice 4 Shorts happened:https://www.tradingview.com/chart/MANAUSDT.P/7BnxvY62-MANA-Beautiful-Signal-4-Trades/
4- On 20th March i gave 2 new Levels (void lines).
OMG ! To The Fcking Point. Sniped
Look how that upper grey trend line played out too.
6 % 👌 🎯
4.6 % 👌 🎯
5.5 % 👌 🎯
Follow for more ideas/Signals. 💲
Look at my other ideas 😉
Just donate some of your profit to Animal rights and rescue or other charity :)✌️

$MANA Consolidating – Breakout or Breakdown Ahead?
MANA is currently trading within a descending triangle, signaling a potential move soon. The next breakout or breakdown will determine the trend direction.
📉 Daily Timeframe Update
🛑 Price is consolidating within a bearish structure, awaiting confirmation
🔼 A breakout above resistance could trigger a bullish reversal
🔽 Losing support may result in further downside
Momentum is building—watch key levels closely! 🚀

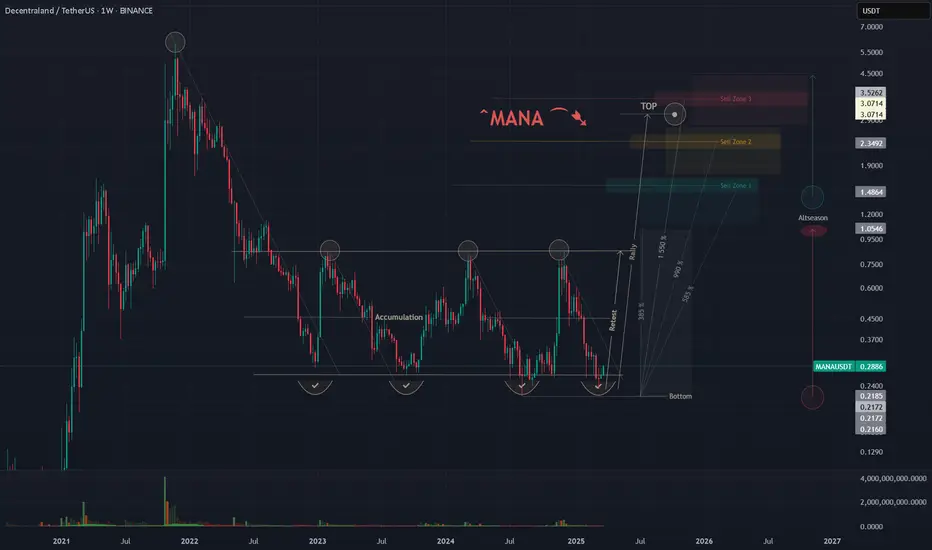
MANA/USDT | 1W🩸 OTC:MANA ⁀➷
#Decentraland. Macro chart Another
💯 Intermediate Target - $1.05
🚩 Macro Target 1 - $1.48
🚩 Macro Target 2 - $2.34
🚩 Macro Target 3 - $3.52
- Not financial advice, trade with caution.
#Crypto #Decentraland #MANA #Investment
✅ Stay updated on market news and developments that may influence the price of Decentraland. Positive or negative news can significantly impact the cryptocurrency's value.
✅ Exercise patience and discipline when executing your trading plan. Avoid making impulsive decisions driven by emotions, and adhere to your strategy even during periods of market volatility.
✅ Remember that trading always involves risk, and there are no guarantees of profit. Conduct thorough research, analyze market conditions, and be prepared for various scenarios. Trade only with funds you can afford to lose and avoid excessive risk-taking.
MANAUSDT 1WMANA ~ 1W Analysis
#MANA Buy gradually from here if you still have a Conviction on this coin with a short -term target of at least 20%+.

MANA - Some new Interesting POIs and LevelsI gave a MANA TA days ago and it gave us 4 nice Trades.
Now some new levels and POIs.
Previous Signals:
Follow for more ideas/Signals. 💲
Look at my other ideas 😉
Just donate some of your profit to Animal rights and rescue or other charity :)✌️

MANA - Beautiful Signal. 4 TradesMANA Level gave us 4 nice Trades 👌 🎯
13% + 6% + 8% + 6%
Original Signal here:https://www.tradingview.com/chart/MANAUSDT.P/adttA7xG-MANA-it-looks-bullish-regarding-Volume/
Follow for more ideas/Signals. 💲
Look at my other ideas 😉
Just donate some of your profit to Animal rights and rescue or other charity :)✌️

MANA - it looks bullish regarding Volume! There are some bullish divergences in Volume in 2h+.
Even daily Volume is really bullish.
We may have missed a Long opportunity. But a Short at those marked Levels are reasonable!
Eyes on both AVWAPs (blue) and upper pink trend line and yellow marked level.
Higher Time Frame:
Small Spot buy at orange Trend line could be reasonable too
For scalpers:
Blue box level is interesting for a scalp(Long or Short must be analyzed again, if reached there)
Follow for more ideas/Signals. 💲
Look at my other ideas 😉
Just donate some of your profit to Animal rights and rescue or other charity :)✌️

MANA - Signal/TA was given 2 days ago. What a NICE TA :)What a beautiful rejection from the levels and lines.
First level was a front run 😂. A bummer. missed 13 % short.
lower pink TL had a nice reject and gave 9 % 👌 🎯
Here the TA days ago:
The lines and levels are still active. Eyes on it.
! BTC will drop more !
Follow for more ideas/Signals. 💲
Look at my other ideas 😉
Just donate some of your profit to Animal rights and rescue or other charity :)✌️

MANA Accumulating – Ready for a Pump?$MANA/USDT weekly chart shows the price moving within a sideways accumulation zone, respecting a rising support line after a prolonged downtrend.
It is currently testing the 50 EMA, which acts as a key resistance level. A breakout above this could signal further upside, while failure to hold could lead to a retest of the support zone.
The Stoch RSI is in the oversold region, suggesting potential bullish momentum. If MANA breaks above 0.35 USDT, it could push towards 0.70 USDT+, while a drop below 0.20 USDT might extend the bearish trend.
DYOR, NFA
Do Likes and follow us

MANA Roadmap (1W)From the point where we placed the red arrow on the chart, it seems that the correction of MANA has begun.
It appears to be forming an ABC pattern, where wave B is a diametric.
Currently, we seem to be at the end of wave f of B.
The price is expected to drop to the green zone, where wave C will be completed.
After wave C is completed, we anticipate a strong upward move in price.
For risk management, please don't forget stop loss and capital management
Comment if you have any questions
Thank You

MANA ▍Potential 30 to 67xIn the last bull run, BINANCE:MANAUSDT formed a multi-bottom pattern and then skyrocketed 300x from the bottom.
Now, COINBASE:MANAUSD is shaping a similar multi-bottom, and we could currently be at the orange box.
IF the bull still coming, using Fibonacci to estimate the potential upside for this cycle, the target range is around 30x - 67x.
Not as crazy as last time, but still an impressive multiple! 🚀
Worth a try if you believe in it; If not, short it.
🔴 Read my signature & publications for more info you don’t want to miss.
🔥 for more future "guesses" like this!

MANAMANA
🚀 Decentraland (MANA/USDT) – The Next Big Move? 🚀
📊 Elliott Wave Analysis (2-Week Timeframe)
MANA is following a clear Elliott Wave structure, and the next major rally could be massive! 🔥
📌 Wave Breakdown:
🟢 Wave 1 & 2 – Early impulse followed by a correction.
🚀 Wave 3 – A powerful bullish wave pushed MANA to its all-time high.
🔻 Wave 4 – A deep correction, forming a channel structure.
📈 Wave 5 (Upcoming Move!) – A breakout towards $7+ is expected!
📍 Key Observations:
✅ Price is currently at the bottom trendline – a critical accumulation zone.
✅ The next move aligns with Wave 3 of a smaller degree, which could be parabolic! 📈
✅ Potential target: $7+ and beyond in the long run.
⚠️ Conclusion: If this structure holds, MANA could be gearing up for a massive breakout soon! 🚀
🔔 Stay tuned for more updates!
#MANA #Crypto #ElliottWave #Trading

manaMy personal opinion is to buy in the specified area below. It should be reviewed according to market conditions.

MANAIf the price reaches the desired range in a wedge pattern with candlestick compression and divergence, it is suitable for shorting. Provided that a reversal candlestick is formed.

Important Update on MANA (3D)First and foremost, pay attention to the timeframe. It is a 3-day timeframe and requires patience.
By analyzing the waves of MANA and considering that it has been oscillating within a range for an extended period, it can be inferred that MANA is forming a diametric or symmetrical pattern within wave B.
It appears that wave E of this diametric has concluded, and the price is currently in wave F.
The green zone is a low-risk area for buying, as wave G could start from this range.
Wave G is a bullish wave.
A daily candle closing below the invalidation level would invalidate this analysis.
For risk management, please don't forget stop loss and capital management
Comment if you have any questions
Thank You
