#MANA (SPOT) entry range( 0.2510- 0.3110) T.(0.5990) SL(0.2388)BINANCE:MANAUSDT
entry range ( 0.2510- 0.3110)
Target1 (0.3819) - Target2 (0.4660)- Target3 (0.5990)
1 Extra Targets(optional) in chart, if you like to continue in the trade with making stoploss very high.
SL .1D close below (0.2388)
*** collect the coin slowly in the entry range ***
*** No FOMO - No Rush , it is a long journey ***
**** #Manta ,#OMNI, #DYM, #AI, #IO, #XAI , #ACE #NFP #RAD #WLD #ORDI #BLUR #SUI #Voxel #AEVO #VITE #APE #RDNT #FLUX #NMR #VANRY #TRB #HBAR #DGB #XEC #ERN #ALT #IO #ACA #HIVE #ASTR #ARDR #PIXEL #LTO #AERGO #SCRT #ATA #HOOK #FLOW #KSM #HFT #MINA #DATA #SC #JOE #RDNT #IQ #CFX #BICO #CTSI #KMD #FXS #DEGO #FORTH # AST #PORTAL #CYBER #CLV #RIF ENJ #ZIL #APT #MAV #ZRX #ID #AXS #MANA ****
MANAUSDT trade ideas

MANA is gearing up for a major breakthrough!I'm a big fan of meta universes and couldn't just not make a plan for MANA, the leading project in this area!
We are technically above 50 EMA and preparing for a breakout from the parallel channel. The project has a capitalization of almost 1 billion and I would expect a hike to the $3 per coin area and reach a capitalization of 6 billion, which corresponds to the 0.5 fibonacci level.
This is a huge prospect considering that the next coronavirus analog as well as potential VR development will attract new investors to the project and send it into the space!
Horban Brothers.

MANA/USDT is flipping above the SuperGuppy dynamic resistanc💰 #MANA/USDT is flipping above the SuperGuppy dynamic resistance👀
This time we will make it back above the key zone and pump✈️
✔️1 Target - 1.5$
✔️2 Target - 2.1$
✔️3 Target - 3.85$

Mana usdt So this other coin mana metaverse and virtual world similar to Sand coin also has a nice set up . Won’t be surprised if this coin does. 50% gains from here , down trend line is broken if the weekly closes above it , small position here could be nice .
$MANA Update-Up 20% from last post, above 200MA - Blast Off SoonUp 20% from last post, if you have been following my trades... EURONEXT:MANA IS READY!
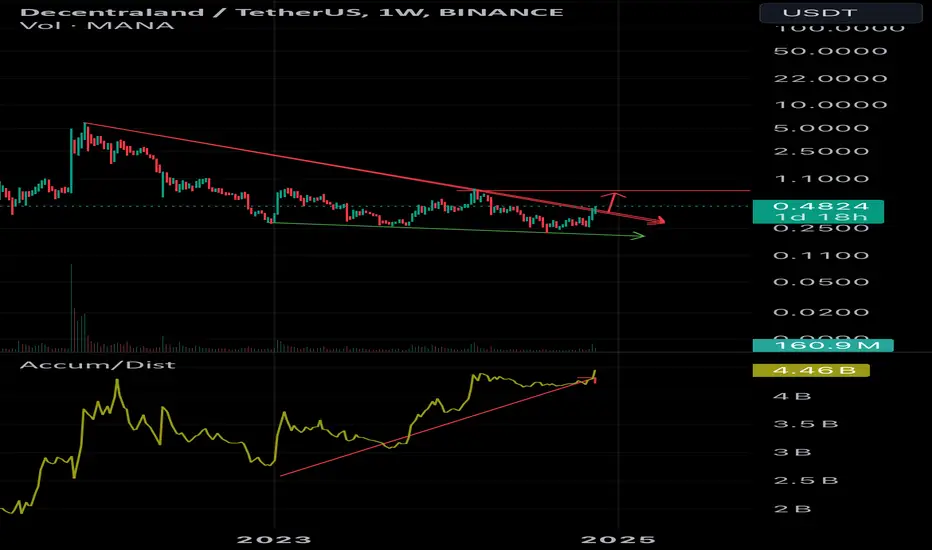
MANA/USDT Trading ScenarioDespite the rapid growth of BTC and many popular assets in the crypto market, some altcoins from promising projects remain heavily oversold and undervalued. One example is the native token of the Decentraland metaverse — MANA. It is currently trading 95% below its all-time high and is near a local minimum.
From a volume profile perspective, the asset is attracting market participants in the current price range, and the accumulation phase has been ongoing for almost two years. If liquidity starts to shift from BTC into altcoins during an altseason, this token could experience significant growth and provide investors with a solid profit.

MANAUSDT 1WMANA ~ 1W
#MANA This chart is very interesting,. It is very bullish if this resistance line is successfully broken. if you still have Conviction on this coin. Buy in stages starting from here. minimum target 20%++
#MANA/USDT#MANA
The price is moving in a descending channel on the 1-hour frame and is sticking to it well
We have a bounce from the lower limit of the descending channel and we are now touching this support at 0.2980
We have a downtrend on the RSI indicator that is about to be broken, which supports the rise
We have a trend to stabilize above the 100 moving average
Entry price 0.2988
First target 0.3045
Second target 0.3121
Third target 0.3200

#MANTA/USDT#MANTA
The price is moving within a bullish channel pattern on the 4-hour frame, which is a strong retracement pattern
We have a bounce from a major support area in the color EUR at 0.300
We have a tendency to stabilize above the Moving Average 100
We have an upward trend on the RSI indicator that supports the rise and gives greater momentum, upon which the price depends
Entry price is 0.3300
The first target is 0.3752
The second target is 0.4050
The third target is 0.4400

#MANA: Investing in the Future of Virtual WorldsDescription:
This trading idea centers on MANA, the native token of Decentraland, one of the pioneering virtual reality platforms powered by blockchain. MANA serves as the currency within this expansive digital ecosystem, allowing users to purchase land, goods, and services while participating in a decentralized metaverse. As the demand for immersive virtual experiences and digital assets continues to rise, Decentraland’s growing user base and its collaborations with high-profile brands and creators underscore MANA's potential for long-term adoption and growth within the metaverse space.
However, it's important to note that investments in cryptocurrencies like MANA are subject to high volatility. Regulatory shifts, technological advancements, and macroeconomic factors can all impact market dynamics and token valuation. Investors should be aware of these risks and develop a robust strategy to mitigate potential downsides.
Disclaimer:
This trading idea is for educational purposes only and should not be considered financial advice. Trading cryptocurrencies like MANA involves substantial risk, including the possibility of losing your entire investment. Always perform thorough research, evaluate your financial position, and consult with a professional advisor before making any investment decisions. Past performance is not indicative of future results.

manausdyConsidering Mana’s resistance at the current support level, such a move can be expected in the long term

MANA back to GloryThe crypto boom has just begun and with BTC making new ATHs i have decided to start sharing some of my personal crypto plays for this cycle. MANA along with SAND are my metaverse crypto plays that ill be covering during this crypto cycle, have been holding these for a while and think its time for them to bounce back. I have outlined some of my targets but depending on how hot things get we may see a lot more 👀
Added to my position today, best of luck!

$MANA Update-Bullish Wave Coming!-Up over 30% from last postUp over 30% from last post.
Price has been beautifully respecting the support zone and consolidating the past 3 months.
I expect a bullish breakout above the 200MA soon, quickly setting a new support zone then a bullish push challenging at least the 50%-100% Fibonacci price zone.

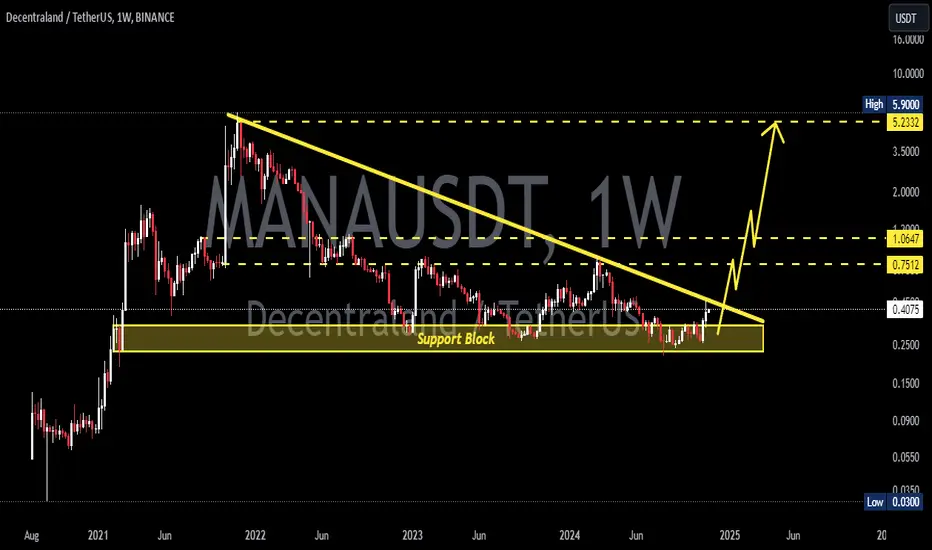
MANA/USDTLong term targets marked in the chart.
accumulate under $0.5
TP 1 : $0.8
TP 2 : $1.35
TP 3 : $2.11
TP 4 : $2.8
TP 5 : $3.64

MANAUSD_1Dhello
Analysis of the symbol MANAUSD from the cryptocurrency market
We are a market buyer, maintaining the important support number of 0.3000
and Syosod at the price of 0.5555
85% growth rate

Decentraland (MANA): Waiting For Resistance To Be Reached!! /Decentraland seems to form a nice setup here where bullish trend is pushing price higher and higher toward that major resistance zone where we are going to look for a short setup.
If everything plays our nice, we should see a quick and sharp move to lower zones after a rejection from resistance, so let's wait and see how it will go 😉
Swallow Team

The medium term of MANA is super bearishMedium term MANA is super bearish
According to the waves that formed in these last two months, the scenario of MANA has become clearer.
It looks like we have a big ABC, and wave B is a triangle.
The last triangle wave of wave B could end in the red range and then we could see another bearish trend for MANA in the medium term.
This is the vision we now have for MANA.
Closing a weekly candle above the invalidation level will violate the analysis
For risk management, please don't forget stop loss and capital management
Comment if you have any questions
Thank You

#MANAUSDT Daily ChartPrice had previously bounced off our minor demand zone at $0.267 and it is currently ranging inside the daily supply zone. MACD is showing some bullish weakness, and price is currently getting rejected off the 100MA. Price needs to break and close above $0.32 in order to expect further bullish movements towards the next area of supply at $0.34.

[MANAUSDT] - Keep ur eye on it!as u see ... clearly wyckoff accumulation on weekly chart
price now is at a rock bottom
i recommend it for long term investment.
best regards Ceciliones🎯

Analysis and trading in 1 hourDue to the decrease in buyers and decrease in liquidity, there is a possibility of a short-term drop
entry:(0.2630_0.2648)
st:0.2672
tp:0.2572

MANA BULLISH divergence at support level!!MANA/USDT bullish divergence at support level
Will this break the downtrend and make a move up?
Awaiting break and retest at 0.255
SL 0.244
TP 0.28

Analysis and trading in 30 minutesAccording to the pattern and liquidity of the buyers, there is a possibility of an increase, which is specified below the entry and transaction points
entry:(0.2680_0.2654)
st:0.2630
tp:0.2820

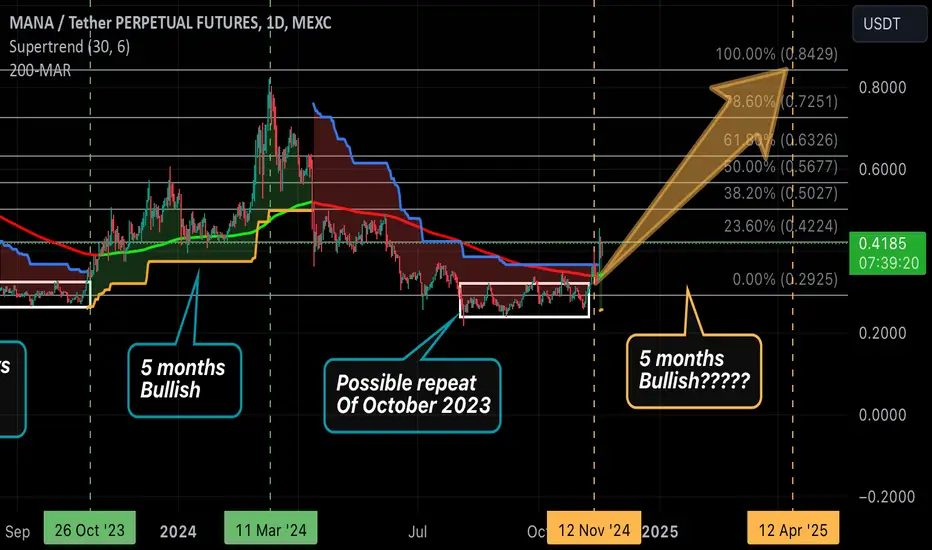
MANA looking real prime for Bull WaveCan you see the potential October 2023-March 2024 pattern repeat on the horizon?
Sitting at 0.0% Fib is a bargain.
More upside potential than downside.
The next 4 to 6 weeks is critical for pattern confirmation.
Of course indicators/fundamentals need to show bullishness before opening a mid term position. SOMETHING TO KEEP AN EYE ON!
