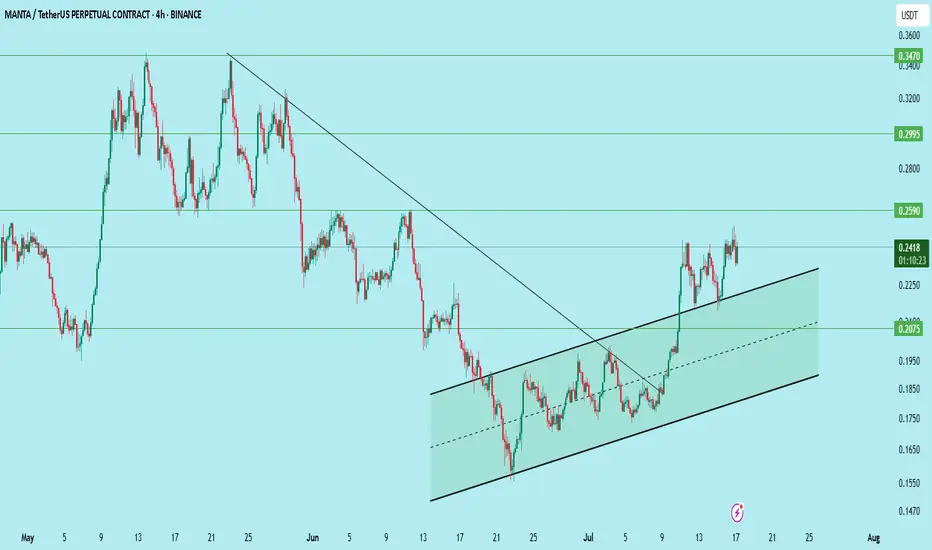
MANTA/USDT – Bullish Setup AlertMANTA has broken out of its long-term downtrend and is now trading within a clear rising parallel channel on the 4H chart.
Structure:
Downtrend broken
Higher highs and higher lows forming
Price respecting channel boundaries
Setup:
Entry: 0.225 (wait for retest)
Stop Loss: 0.2075
Target 1: 0.259
Target 2: 0.2995
Target 3: 0.347
Support: 0.225 / 0.2075
Resistance: 0.259 / 0.2995
Wait for the retest before entering. Risk-reward is attractive if the structure holds.
DYOR. Not financial advice.
MANTAUSDT trade ideas
MANTAUSDT Forming Descending ChannelMANTAUSDT is shaping up to be one of the more intriguing setups in the market right now, showing a well-defined descending channel pattern. This technical formation often signals a healthy consolidation phase within a broader trend, creating a launchpad for an eventual breakout. With trading volume remaining good and steady, there is a strong foundation for a significant move that could yield an 80% to 90% gain once the channel’s resistance is convincingly broken.
The MANTA project itself is increasingly attracting investor interest, thanks to its innovative approach to DeFi and cross-chain privacy solutions. As the crypto sector continues to look for new ways to scale and protect user data, MANTA stands out as a project that combines real-world use cases with strong tokenomics. This growing community interest can add momentum to the pair’s technical breakout, potentially driving the price rapidly towards its expected targets.
From a technical perspective, the descending channel acts like a coiled spring. When prices repeatedly test the lower support and upper resistance of the channel, traders watch for a breakout confirmation, which can lead to a sharp trend reversal. The combination of this reliable pattern with increasing investor confidence makes MANTAUSDT a pair worth watching closely for bullish signals in the coming sessions.
✅ Show your support by hitting the like button and
✅ Leaving a comment below! (What is You opinion about this Coin)
Your feedback and engagement keep me inspired to share more insightful market analysis with you!

MANTA Holding Rising Support — Eyes on BreakoutMANTA is once again respecting the rising support line and showing early signs of holding the structure.
Price action remains constructive — despite recent volatility, buyers are still defending the trendline well. As long as this rising support continues to hold, the setup remains bullish.
The next key area to watch is the resistance zone above. A breakout through that level could open the door for a much larger move, as visualised in the projected path.
For now, MANTA is in a healthy consolidation phase along the trendline. If momentum builds from here, it could trigger the next leg higher.

MANTAUSDT 1D AnalysisMANTA ~ 1D Analysis
#MANTA If you are interested in this coin, maybe you can consider this support to start buying back from here with a short-term target of at least 15%+
#MANTA/USDT#MANTA
The price is moving within a descending channel on the 1-hour frame, adhering well to it, and is heading for a strong breakout and retest.
We are seeing a bounce from the lower boundary of the descending channel, which is support at 0.290.
We have a downtrend on the RSI indicator that is about to be broken and retested, supporting the upward trend.
We are looking for stability above the 100 moving average.
Entry price: 0.305
First target: 0.329
Second target: 0.348
Third target: 0.373

Manta Classic Bullish Signals = Bull Market Confirmed—PP: 1900%This analysis can be used not only to spot the trading opportunity that is now MANTAUSDT, but also for learning purposes. Let's go back to basics.
Here MANTAUSDT is breaking daily above EMA55. This break is happening with a full green candle and yesterday's candle also closed full green. Today's full green candle has above-average trading volume and is coming after several short-term higher lows. So this is a constellation of signals. One signal, the break of resistance, supported by many additional signals (volume, candles and chart pattern).
The classic signal is the break above EMA55 on the daily timeframe. This confirms a bullish potential for the mid-term, minimum, which means 3 months.
The next signal comes from the RSI, it is super strong. A hyper bullish RSI while a project is trading at bottom prices is another classic bullish strong reversal signal. It is present here.
These together, with marketwide action, what the rest of the market is doing, is more than enough for me to say: Manta is going up.
Thank you for reading.
Namaste.

MANTA DID 50% PROFITLast month it was shared as swing trade and now its 50% up and huge profit target done.

MANTAUSDT 1D#MANTA has broken above the descending resistance and is now facing the daily MA100. A breakout above the MA100 could trigger the following targets:
🎯 $0.331
🎯 $0.439
🎯 $0.613
⚠️ Use a tight stop-loss.

MANTA: The Pacific#MANTA is one of the Binance Launchpool coins listed in late 2023–early 2024, most of which dumped heavily post-launch, draining liquidity from beginner users.
Despite that, OMXHEX:MANTA may have completed a major zigzag correction after a strong bounce from ATL.
Holding above that low could spark a major bull-run, potentially recovering early investor losses.
#MantaNetwork

Manta Network Bottom Situation—Trading Tips & Tricks (575% Rise)We have a situation here where the market bottom has been confirmed.
Notice that MANTAUSDT is trading above its 11-March low but below its 3-Feb. low. The pairs that are trading above the 3-Feb. low are stronger from a TA perspective and from a trading perspective and likely a fundamental perspective as well, compared to those trading below.
They are stronger first because the recovery is strong and second because the crash was smaller. In both cases, the rise and the drop, the market showed more support and action on these. This is something to keep in mind when choosing your pairs.
Stronger pairs tend to produce better results.
When retraces and corrections happen, they tend to happen all across. So those stronger will continue to outperform and you better choose those when choosing you Altcoins, with some exceptions of course.
There are thousands of Altcoins and it is hard to choose.
For me, I chose on 7-April when the bottom hit, so all are green, but the world (and trading) doesn't end there. The truth is that bottom prices are great but available only for the short-term.
You can use moving averages as well to know which pairs are better than another and which ones are more likely to move next. The ones trading above the longer EMAs are the ones that are stronger.
Just a few tips and tricks to improve your chances of success.
Thank you for reading.
Namaste.

MANTA/USDT – Bullish Structure Forming MANTA/USDT – Bullish Structure Forming
MANTA is showing early signs of a trend reversal, with multiple confluences indicating strength from the bulls. After a prolonged downtrend, the asset has not only broken key resistance levels but also flipped the 50 EMA, a major dynamic resistance, into support.
✅ Key Technical Highlights:
Double Bottom Formation:
The chart has clearly printed a double bottom, one of the most reliable reversal patterns.
This formation suggests that bears are losing control and buyers are starting to step in with conviction.
Breakout Above the 50 EMA:
Price has decisively broken above the 50 EMA (~0.2127), which had previously acted as dynamic resistance during the downtrend.
Notably, the price retested the 50 EMA and successfully bounced, confirming it now as support.
Resistance Flip to Support:
The previous horizontal resistance zone has been breached and retested, reinforcing its role as a demand zone.
Market Structure Shift:
Lower highs and lower lows have now transitioned into higher lows and higher highs, signaling a structural shift from bearish to bullish.
Momentum and Candle Structure:
The bullish candles post-retest show strong momentum with minimal upper wicks — a sign of buyer strength.

MANTA Breakout Trade Setup – Long OpportunityMANTA has broken out of a clean ascending triangle formation, confirming bullish strength. The breakout happened just above a key horizontal resistance and the 50 EMA, flipping both into support.
The chart shows a strong impulse candle on breakout, with a well-placed stop below the ascending trendline and a healthy 4.5R risk-reward to the upside. RSI sits near neutral (50.86), suggesting there's still room for price expansion.
DYOR, NFA

MantausdtManta usdt looks like just start of wyckoff accumulation pattern.here it looks like Selling climax .we may see some short term bounce from this zone before forming another low .sc is followed by automatic rally then secondry test and upthrust followed by froming another low. This just looks the start of accumulation pattern which suggests may we we will range another month or a two here before accunulation completes .

MANTA NETWORKIF manta can get out of this channel i see an up trend !!
Target 268 % up.
Hold and load your bag !!


MANTA/USDT: Breakout Alert: 60-70% Upside Incoming!🚀 Hey Traders! MANTA Breakout Incoming! 👋
If this setup gets you hyped, smash that 👍 and hit Follow for high-quality trade setups that deliver real results! 💹🔥
MANTA is looking bullish and ready to explode! 📈 It’s breaking out of a falling wedge on the 4-hour timeframe, signaling a potential 60-70% upside move. Now’s the time to long and add on dips!
🔹 Entry Range: CMP – Add more up to $0.63
🎯 Targets:
✅ Target 1: $0.76
✅ Target 2: $0.85
✅ Target 3: $0.94
✅ Target 4: $1.10
🛡 Stop Loss (SL): $0.59
⚙️ Leverage: Use low leverage (Max 5x)
💬 Your Thoughts?
Are you bullish on MANTA’s breakout? Drop your analysis, predictions, or strategies in the comments! Let’s ride this wave and lock in those gains together! 💰🔥

$MANTA Falling Wedge Breakout Loading? OMXHEX:MANTA Falling Wedge Breakout Loading? 🚀
MANTA is forming a bullish falling wedge pattern on the 6H chart!
Key support zone holding strong
RSI showing signs of reversal
Breakout above $0.65 could send price flying towards $2+
This setup looks primed for a massive move!
Are you ready?

MANTA Accumulation ZoneMANTA now in super big support, maybe we can see manipulation order like around 0.3-0.4
But if this is turning point or rounding pattern maybe we will see $1 as the next target

Manta zones for accumulationManta IAP model with accumulation zones BINANCE:MANTAUSDT
Possible Targets and explanation idea
➡️IAP model zones for accumulation marked on a screen
➡️From signal confirmation to sell on TradeOn indicator -62% short profit
➡️Appeared signal take profit and close short position
➡️On daily we saw local signal to buy and small bounce.
➡️Step by step you can accumulate now or wait main zones for accumulation with DCA
➡️2 main money inflow periods with money power indicator. whales accumulate
Hope you enjoyed the content I created, You can support with your likes and comments this idea so more people can watch!
✅Disclaimer: Please be aware of the risks involved in trading. This idea was made for educational purposes only not for financial Investment Purposes.
---
• Look at my ideas about interesting altcoins in the related section down below ↓
• For more ideas please hit "Like" and "Follow"!

Don't miss this jump on MANTA!Hi fellow traders, MANTAUSDT is ready to make a move higher after completing the complex correction in WXY formation. Target the 1.4961 level. Good luck and trade safe!

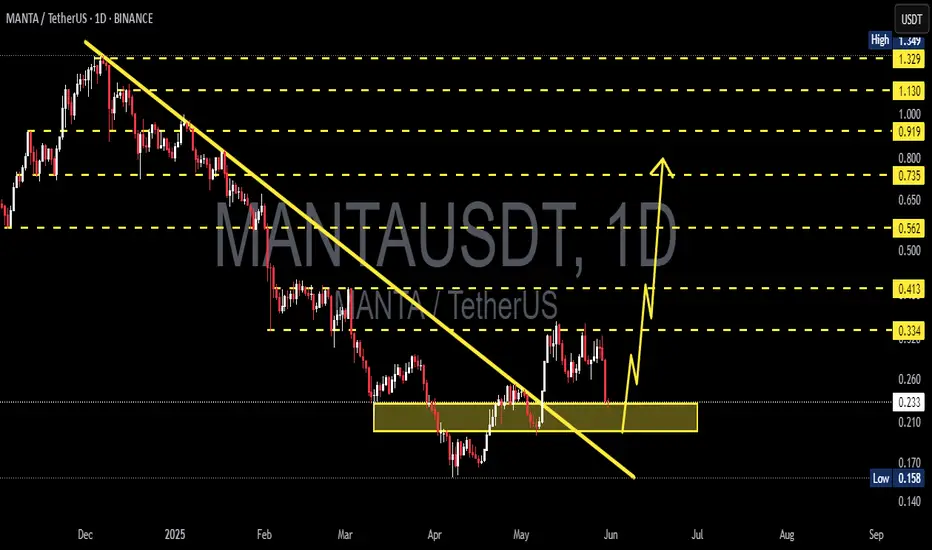
MANTA/USDT CHART UPDATE !! MANTA/USDT daily chart highlights a promising long-term trade setup with a strong bullish potential.
The chart shows an upward-sloping trendline that has been respected since the token’s inception. It serves as a crucial support level around $0.75–$0.80.
The price is consolidating near the trendline support, creating a low-risk entry zone for long positions.
A rapid bounce off this zone could signal the start of a strong upward move.
The chart indicates a large, bullish arrow towards $4.00, suggesting a potential 4x move upon exiting this accumulation phase.
The main resistance zones are near $1.50 and $2.50 before reaching the $4.00 target.
Risk Management:
If the price breaks below the trendline, it will invalidate the bullish setup, indicating caution.
If you found this analysis helpful, hit the Like button and share your thoughts or questions in the comments below. Your feedback matters!
Thanks for your support!
DYOR. NFA

#MANTA Primed for a Breakout! OMXHEX:MANTA is getting ready for another leg up! 🚀
A strong bounce is expected once it breaks out.
Keep an eye on this setup—it could present a great opportunity!
Stay tuned, and don’t forget to follow.
DYOR, NFA
#Crypto #Altseason2025

Manta/UsdtBINANCE:MANAUSDT
$Manta/Usdt
Current Price: $0.859
Support Level: $0.8972 (
watch)
Key level to
Resistance Levels:
$1.00
(First resistance)
$1.23
(Major target if upward
momentum continues)
If price holds at support, it could bounce
toward these resistance levels.
Not Financial Advice!
