DXY TrendlinesUnless it brakes the downtrend with a weekly candle close it should bounce back up in long run. should be closely monitored since it will give us a lot of information about current market direction. i expect bouncing back up but we will see.
DOLLARINDEX trade ideas

US DOLLAR ANALYSIS !!The US Dollar has broken below its ascending channel structure. The Ichimoku Cloud is now serving as a resistance zone, suggesting ongoing bearish pressure. If the retest of the broken pattern holds, further downside movement is likely.
Given the usual inverse relationship between the US Dollar and the cryptocurrency market, this development could carry notable implications for crypto traders.
Stay alert!

DOLLAR INDEX The dxy is the measure of the united state dollar relative to basket of six majors foreign currencies, it was originally developed by U.S Federal Reserve in 1973 to provide a trade -weighted average value of the dollar against global currencies.
the six currencies are EURO 57%,JPY 13.6%,GBP 11.9%,CAD 9.1% SEK 4.2% CHF 3.6%
The index rises when the dollar strengthens against these currencies and falls when it weakens ,its used to gauge the overall strength of the us dollar in the global market.
US10Y
THE US10Y ,the treasury note yield is the interest rate the U.S government pays to borrow money for 10 years ,it serves as a crucial benchmark for other interest rates and is a key indicator of the investor sentiment about the economy, in context it reflects the return an investor expect for lending money to the U.S. government for a decade .
the interest is paid semi annually at a fixed coupon rate and the yield moves inversely to bond price; when bond price fall the yield rises, and vice versa .
this have a direct effect on borrowing cost across the economy ,including mortgage rates and corporate loans .
when yield is rising investor optimism is high about the economic growth and inflation ,while failing yield indicates economic caution and recession fear and concern
technical interpretation of the monthly chart
the dxy is in buy back position on ascending trendline line ,but price remains below supply roof and if we get monthly retest of broken demand floor we could see price selling off.
trading is 100% probability.

DOLLAR INDEX TRADING CHEACK LIST.
The dxy is the measure of the united state dollar relative to basket of six majors foreign currencies, it was originally developed by U.S Federal Reserve in 1973 to provide a trade -weighted average value of the dollar against global currencies.
the six currencies are EURO 57%,JPY 13.6%,GBP 11.9%,CAD 9.1% SEK 4.2% CHF 3.6%
The index rises when the dollar strengthens against these currencies and falls when it weakens ,its used to gauge the overall strength of the us dollar in the global market.
US10Y
THE US10Y ,the treasury note yield is the interest rate the U.S government pays to borrow money for 10 years ,it serves as a crucial benchmark for other interest rates and is a key indicator of the investor sentiment about the economy, in context it reflects the return an investor expect for lending money to the U.S. government for a decade .
the interest is paid semi annually at a fixed coupon rate and the yield moves inversely to bond price; when bond price fall the yield rises, and vice versa .
this have a direct effect on borrowing cost across the economy ,including mortgage rates and corporate loans .
when yield is rising investor optimism is high about the economic growth and inflation ,while failing yield indicates economic caution and recession fear and concern
technical interpretation of the monthly chart
the dxy is in buy back position on ascending trendline line ,but price remains below supply roof and if we get monthly retest of broken demand floor we could see price selling off.
trading is 100% probability.

DXY Bullish IdeaDXY has been printing Lows since past weeks and is currently testing a good long term support. A good bounce is expected in dollar.
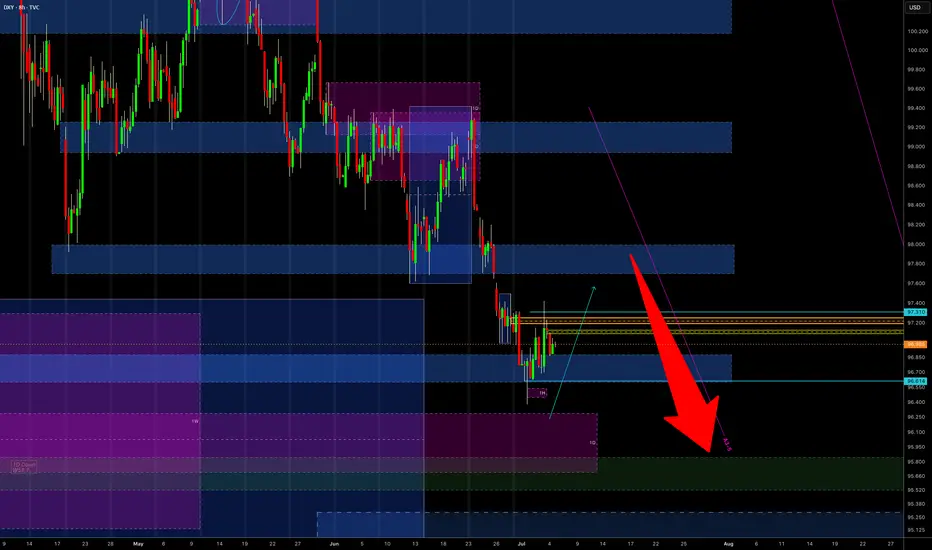
DXY 4H BEARISH SETUPDXY is still bearish. I’m watching for a retracement into the 4H OB, where I expect price to reject and continue the bearish move toward the 96.30 level..
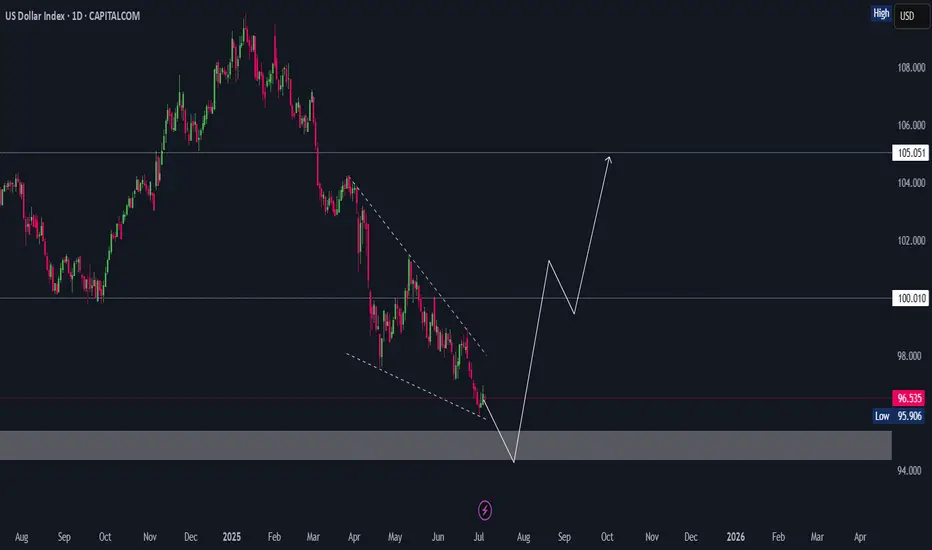
DXY Weekly ForecastDXY Weekly Forecast
- look for down move when reaching 98.00 level
A Message To Traders:
I’ll be sharing high-quality trade setups for a period time. No bullshit, no fluff, no complicated nonsense — just real, actionable forecast the algorithm is executing. If you’re struggling with trading and desperate for better results, follow my posts closely.
Check out my previously posted setups and forecasts — you’ll be amazed by the high accuracy of the results.
DXY 4Hour TF - July 6th, 2025DXY 7/6/2025
DXY 4hour Bearish Idea
Monthly - Bearish
Weekly - Bearish
Dailly - Bearish
4hour - Bearish
All timeframes are suggesting we are sitll very much bearish. Going into this week we can spot two scenarios that will consider DXY either bullish or bearish.
Bearish Continuation - Ideally we can see price action stay below our 97.500 resistance zone which is also our 38.2% fib level. Look for price action to reject 97.500 with strong bearish conviction. This will most likely confirm a bearish dollar for the week ahead. Keep in mind, price action can push up to the 98.000 zone and still remain bearish.
Reversal - This is the less likely move for the week ahead but not impossible. For us to consider DXY bullish again on the 4hour timeframe we would need to see price action push above our 98.000 resistance area with a confirmed higher low above. Look for strong bullish rejection above & off of 98.000 acting as support. This is the first step for DXY in becoming bullish again.

$DXY: New lows begets new lows. $USM2: Why is it increasing? Here we are again with one more TVC:DXY chart analysis. I think the US Dollar does not fail to surprise us week after week. Making new lows every week is giving a boost to the Equity markets. The SP:SPX and NASDAQ:QQQ are at ATH. In my articles on April 18 and June 16
Perfect trade setup: AMEX:GLD to 325; DXY to 95 for AMEX:GLD by RabishankarBiswal
TVC:DXY weakness and EM markets: NSE:NIFTY more upside? for NSE:NIFTY by RabishankarBiswal — TradingView
We have time and again said that in the near term TVC:DXY chart looks weak and could touch 95 by end of July. I think it might be achieved earlier. We have looked at the consequences of 95 handle on TVC:DXY on various asset classes like AMEX:GLD , NSE:NIFTY and EMs. These asset classes are reaching ATH every single week. But we have seldom investigated the reason behind the weakness in $DXY. Looking through my macro charts I found an amazing chart which might explain most of this weakness.
The ECONOMICS:USM2 is almost at 22 T $ surpassing its previous high on March 2022. M2 is basically the total amount of money in circulation in the economy on top of the nominal M1. Higher M2 indicates higher amount of liquidity which is then channelized into riskier assets like CRYPTOCAP:BTC , AMEX:GLD , SP:SPX , NASDAQ:QQQ and EMS like $NIFTY. And with such high ECONOMICS:USM2 in circulation, it is very clear why TVC:DXY is making new lows each week. This can also explain why US Fed is hesitant to reduce rates. With M2 so high US Fed should not hurry.
Verdict: TVC:DXY to 95 by 31 July, Cycle low of 90 by year end. ECONOMICS:USM2 keeps increasing. US Fed stays put.

DXYDXY still needs more correction upside, once we see more upside we will see if dollar is ready for one last drop.
Disclosure: We are part of Trade Nation's Influencer program and receive a monthly fee for using their TradingView charts in our analysis.

We can expect such a move if the event I mentioned in the captioHello friends..
In the analysis we had previously told you about the dollar index on this page, it started a downward trend right from the specified area (you can visit the page)
Now, after a long time has passed since that analysis, we are now in a suitable range in the dollar index.
See, on the weekly time frame, the index number has hit a strong support area, but we should not make a trading decision by seeing this support unit.
As you can see in the image, if the index number suffers in this range, we can expect a turn in the index.
You can change the trading decisions you have had so far in the event of a turn in the index.
This is just a view from our team, do not attach it to your trades.
.
.
Follow our page to see more analyses.

DXY LONG TERM ANALYSISI anticipate dollar to trade down towards 80. After which we shall look for longs towards 144. This is a long term outlook.
1. first we trade down towards sellside liquidity at 87.
2. Next key level is the 3 month fair value gap at 84
3. Eventually hitting the 25 DRT of the current dealing range at 80.
4. Then we can look to go long targeting 75 DRT of the parent Dealing Range.
5. We shall be coming here weekly to review and correct course as the market unfolds.
THANK YOU.

DXY July 6 AnalysisDXY
July 6
Parent Bias Bear
WEEKLY ANALYSIS
*Good example to witness price trend for the second week-the pull back I was anticipating did occur just not to the level I had suggested in last Sundays journal
*Note Price wicked to the .70 level on the monthly
*Price took key equal lows and rebalanced a FVG from Feb 22
*Monday/Tuesday Price seek lower prices
*Mid week consolidation-expected
*Thursday price took equal highs I was anticipating
*Friday Asia
*PM session of NY price retraced to close in consolidation
*Thursday expansion to buy side then on Friday reversal
WEEK AHEAD IDEAS
*Price closes in a consolidation on the previous days range 50%
*I suspect that price could seek the minor equal highs/FVG potentially reach for the gap from Thursday possible target should it really expand - this could be Sundays delivery
*could price expand for higher prices beginning of the week
*No news until Wednesday
*Sundays delivery can affect my ideas stay open

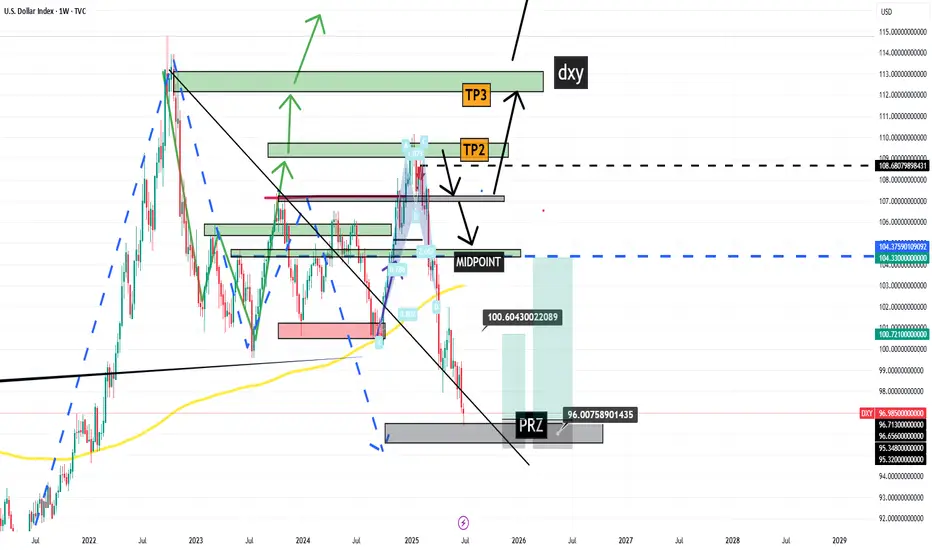
DXY Potential Bullish Reversal – Target 99.456 DXY Potential Bullish Reversal – Target 99.456 🎯
Technical Analysis Overview:
🔹 Trend Structure:
The chart illustrates a recent downtrend, which has been broken as price moved above the descending trendline, signaling a potential trend reversal.
🔹 Pattern Insight:
A bullish harmonic pattern is visible (possibly a bullish Bat or Gartley), with the price reacting from the PRZ (Potential Reversal Zone), aligning with key support near 96.500. The market has respected this zone multiple times, evident from the orange highlighted circles showing price rejections.
🔹 Support & Resistance:
Support Zone: ~96.500
Breakout Zone: ~96.985 (current consolidation near this resistance)
Target Zone: Marked at 99.456, which aligns with previous structure and fib projection.
🔹 Market Sentiment:
Price is consolidating after breaking the downtrend, forming a bullish rectangle (accumulation). The green arrows indicate bullish intent from buyers defending support levels.
🔹 Price Action Signal:
Formation of higher lows.
Break of structure and close above previous highs.
Possible breakout pending above consolidation box.
📊 Conclusion:
DXY shows bullish potential as it builds a base around strong support. A confirmed breakout above the rectangle could fuel a rally toward 99.456. Keep an eye on volume and confirmation candles for entry. ✅

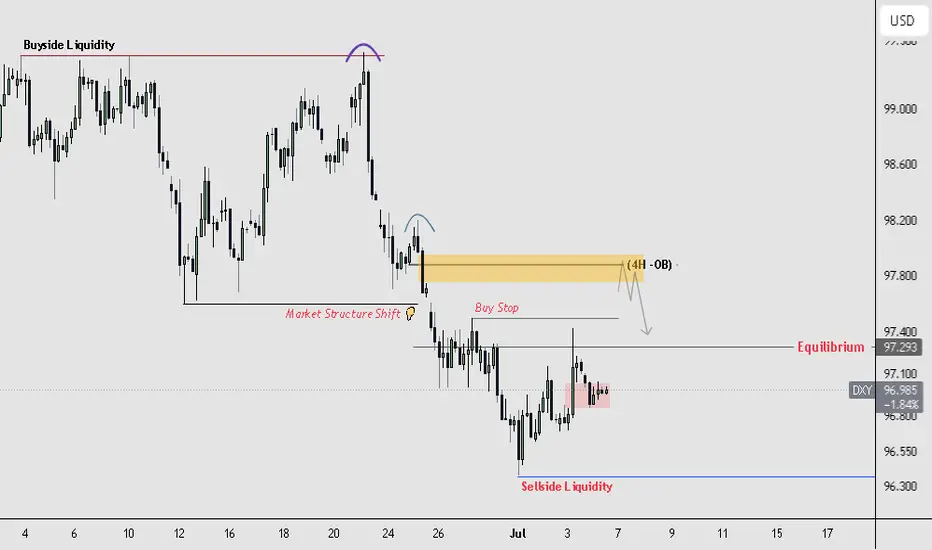
BULLISH ON DXYSince I'm bearish on bonds, I am bullish on the DXY.
I would like to see that 4-hour order block hold and DXY attack the buy-side.
However, I’m open to the idea that we could take out the sell-side liquidity first, then move to the buy-side.
Looking at EUR/USD, we do have equal highs, so perhaps EUR/USD takes out the buy-side liquidity before heading lower.

July 7 - 1th: Sell The RIPs, Buy The DIPs! (PART 1)This is Part 1 of the FOREX futures outlook for the week of July 7 - 11th.
In this video, we will analyze the following FX markets:
USD Index, EUR, GBP, AUD, NZD, & CAD.
Last Friday was a bank holiday, so the price action is discounted. This Monday has no red folders on the calendar, so the environment is set for a day of misdirection. Be careful to take only trades that confirm your directional bias!
USD is still weak, and analyst have determined the FED will put off cutting rates until September. Tariffs wars may start up again July 9th. And Trumps Bill can add 3+ trillion to the debt.
None of this supports the USD!
Look to buy the dips xxx USD, and look to sell the rips vs USD xxx.
Enjoy!
May profits be upon you.
Leave any questions or comments in the comment section.
I appreciate any feedback from my viewers!
Like and/or subscribe if you want more accurate analysis.
Thank you so much!
Disclaimer:
I do not provide personal investment advice and I am not a qualified licensed investment advisor.
All information found here, including any ideas, opinions, views, predictions, forecasts, commentaries, suggestions, expressed or implied herein, are for informational, entertainment or educational purposes only and should not be construed as personal investment advice. While the information provided is believed to be accurate, it may include errors or inaccuracies.
I will not and cannot be held liable for any actions you take as a result of anything you read here.
Conduct your own due diligence, or consult a licensed financial advisor or broker before making any and all investment decisions. Any investments, trades, speculations, or decisions made on the basis of any information found on this channel, expressed or implied herein, are committed at your own risk, financial or otherwise.


#Dollar / #Bitcoin correlation I've previously described the correlation, and it's clear to everyone: a weaker DXY is positive for BTC.
📝Recently, the dollar has grown significantly and seems close to a local maximum (the chart is inverted). This demonstrates the strength of Bitcoin, as it was able to rise even against a strengthening dollar.
💡Imagine its movement when the new administration plans to lower the dollar price like they did last time. I think we will see a similar scenario as in 2017, when the dollar, from a local maximum, begins to provide a tailwind to the movement of assets that trade against it.

DXY (Dollar Index) longs to shortsThe dollar has been bearish for several weeks, but we’re now starting to see signs of a potential retracement due to price being in oversold territory. Last week, DXY reacted from a key weekly demand level, suggesting that we could see some short-term bullish movement before any continuation to the downside.
I’ll be watching closely for price to either push higher into liquidity or retrace slightly deeper into more discounted demand zones for a cleaner long setup. This would also align with my short setups across other major pairs, making DXY strength a key narrative this week.
Confluences for DXY Longs:
DXY has been bearish for an extended period — now showing signs of accumulation on higher timeframes
Price may retrace upwards to collect liquidity before continuing its macro downtrend
Recently reacted from a major weekly demand zone
Imbalances and liquidity above, including Asia highs, remain untapped
P.S. If price fails to react from any of my current POIs, I’ll patiently wait for new zones to develop and adjust accordingly — always staying aligned with what price tells us.
Let’s stay sharp and crush the week ahead!

DXY Is Bearish - But A Retest is Highly ProbableThere is no denying that the overall trend is still bearish. However, price is currently respecting an H4 demand zone - which might continue to apply pressure to the upside for a minor correction.
Of course, if this correction does not happen and the H4 demand zone breaks, then we continue to ride the trend to the downside and all the way to the next weekly TF demand zone.
#TheTrendIsYourFriend

Relation between DXY BTC TOTAL#📄 Analysis of three price charts and comparison between dates and movement
◀️ So far, the anticipated rise in alternative currencies has not occurred, and the rise that has happened is considered small and weak since the bottom of 2022
📄 In the first price chart, we see the movement of the US Dollar Index (DXY)
🔽 Each time the index breaks below the 100.00 level, it has a path to test 90.00, and this path has been achieved twice before during the periods of 2017 - 2018 and 2020 - 2021, with each time lasting approximately 320 days
◀️ At the moment we are in, there has been a break below the 100.00 level in DXY, and we are currently on day 84 of this break
⭕️ In the first break between 2017 - 2018, Bitcoin moved up by 2128%, and alternative currencies moved up by 3030%
⭕️ In the second break between 2020 - 2021, Bitcoin moved up by 608%, and alternative currencies moved up by 1668%
⭕️ In the current third break, which is still in its early stages, Bitcoin has moved up by 48%, and alternative currencies have moved up by 23%
⌛️ This period may extend into the first quarter of 2026, and it is essential to monitor developments closely with daily and weekly follow-ups

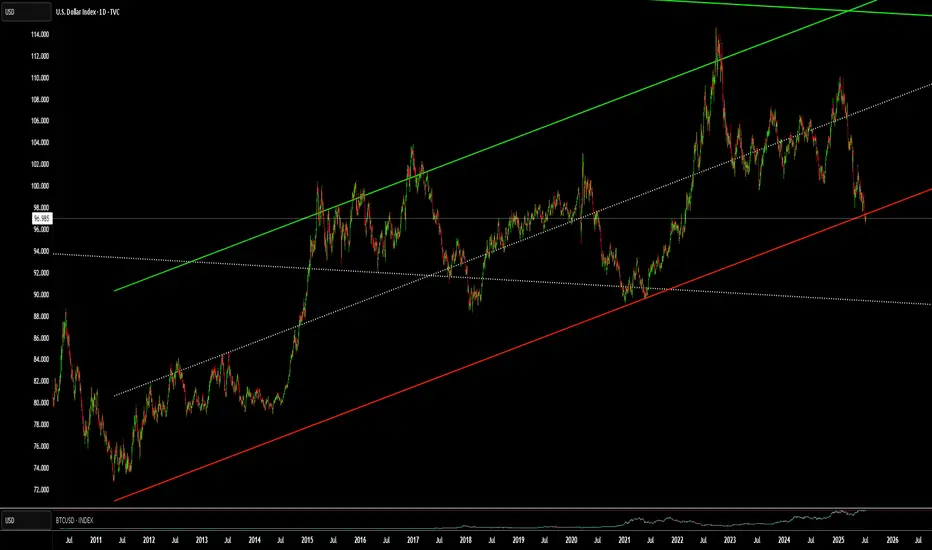
WHy is everyone Freaking out over the DXY !?!?!Here is a chart of the DXY. with a linear regression channel plotted over it. Yes, we are close to the bottom of the channel. But we are no where near an all time low. Far from it. The DXY may be due for a push, but even if it was to drop more it would not be that big of a deal relative to historical patterns.