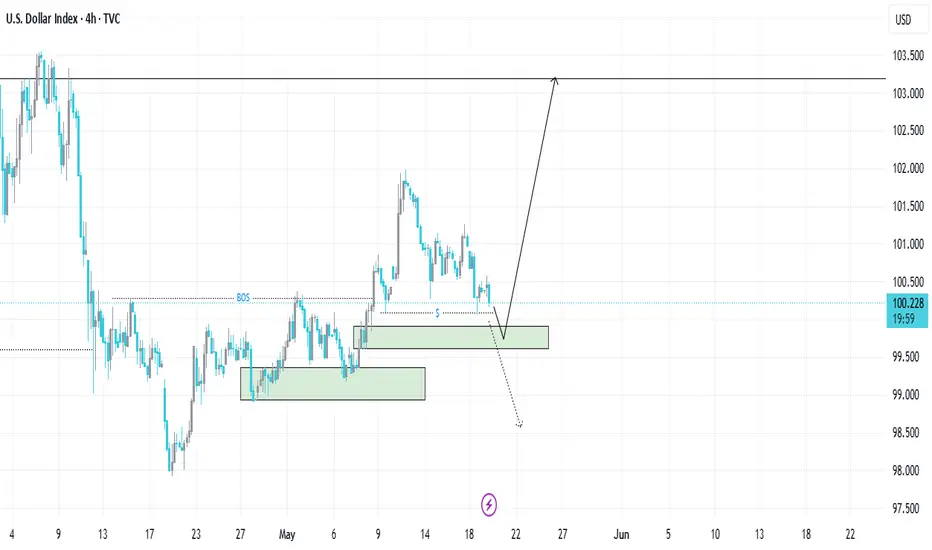
DXY Local Short! Sell!
Hello,Traders!
DXY is making a bullish
Rebound but a horizontal
Resistance is ahead at 100.300
Level so after the retest a
Local bearish correction
Is to be expected
Sell!
Comment and subscribe to help us grow!
Check out other forecasts below too!
Disclosure: I am part of Trade Nation's Influencer program and receive a monthly fee for using their TradingView charts in my analysis.
DOLLARINDEX trade ideas


DXY: The Market Is Looking Down! Short!
My dear friends,
Today we will analyse DXY together☺️
The in-trend continuation seems likely as the current long-term trend appears to be strong, and price is holding below a key level of 99.468 So a bearish continuation seems plausible, targeting the next low. We should enter on confirmation, and place a stop-loss beyond the recent swing level.
❤️Sending you lots of Love and Hugs❤️

DXY_ DATE 22.05.2025DXY_ DATE 22.05.2025
Index starts from lower to higher
Let see US Dollar change character by next week
Cheer

Bullish DXY after Bearish MomentumDXY Expected to Turn Bullish
There was a fakeout observed on the 1-hour timeframe, indicating a potential higher low (HL) formation and a possible breakout to the upside.
DXY Bullish Bias:
Consider buying USDXXX pairs or selling XXXUSD and Gold.

DXY Is Going Up! Buy!
Here is our detailed technical review for DXY.
Time Frame: 9h
Current Trend: Bullish
Sentiment: Oversold (based on 7-period RSI)
Forecast: Bullish
The market is trading around a solid horizontal structure 99.729.
The above observations make me that the market will inevitably achieve 100.749 level.
P.S
Overbought describes a period of time where there has been a significant and consistent upward move in price over a period of time without much pullback.
Disclosure: I am part of Trade Nation's Influencer program and receive a monthly fee for using their TradingView charts in my analysis.
Like and subscribe and comment my ideas if you enjoy them!

Crucial levels for DXY (USD Basket), Risk Trigger On/OffCrucial levels for DXY. If it breaks lower than the lower trendline it tells me that assets like BTC, Gold, Silver, Copper, Palladium and Platinum can shoot to new ATH´s. If the level holds then I think we could hit a correction in the risk assets among assets already mentioned.
TVC:DXY COMEX:HG1! OANDA:XCUUSD OANDA:XAUUSD FX_IDC:XAUUSD ICEUS:DXY FX_IDC:XAGUSD TVC:PLATINUM TVC:PALLADIUM

DXY Bullish move| 🔹 Pair / TF | DXY, 1 h → Lower Timeframes |
| 🔹 Bias | Bullish (buying potential support) |
📊 Key Levels
Level: ~99.117 (orange shaded zone)
Role: Recent Swing Low / Potential Support Zone
Level: ~98.744
Role: Lower boundary of the potential support zone
Level: ~99.727
Role: Potential Resistance (previous swing high)
Level: ~100.116
Role: Higher Potential Resistance
🚨 Trigger
Price has recently touched the ~99.117 - ~98.744 orange shaded zone, which appears to be acting as a potential support area.
There are signs of potential rejection from this zone, indicated by the recent upward price action.
Look for bullish confirmation signals on lower timeframes within this zone.
✅ Confirmation
Observe lower timeframes (e.g., 15m, 5m) for bullish reversal patterns such as double bottoms, bullish engulfing candles, or pin bars forming within the support zone.
The volume indicator at the bottom shows increasing buying volume within the support zone, suggesting potential accumulation.
Look for the Stochastic or RSI on lower timeframes to show oversold conditions followed by a bullish crossover or break above a downward trendline.
No significant bearish momentum or strong selling volume evident as price tests the support zone.
🎯 Entry & Stops
| 🔶 Entry Zone | ~99.117 – ~98.800 (within the potential support zone) |
| 🔴 Stop-Loss | Below the lower boundary of the support zone, potentially around ~98.600 - ~98.500 to allow for some buffer |
Place a Buy Limit or Buy Stop order within the entry zone, depending on your preferred entry style and confirmation.
Risk: Determine your position size based on your risk tolerance and the calculated stop-loss in pips.
🎯 Profit Targets
| Target | Level | Pips (approximate) | RRR |
| :----- | :--------- | :----------------- | :--------- |
| T1 | ~99.727 | ~60-70 | 1 : 1 or better |
| T2 | ~100.116 | ~100-120 | 1 : 1.5 or better |
Scale out:
Consider taking partial profits at T1.
Let the remaining position run towards T2, potentially adjusting your stop-loss to breakeven or in profit.
⚙️ Trade Management
Once the trade is in profit (e.g., reaching a certain pip gain or T1), consider moving your stop-loss to breakeven to protect your capital.
Monitor price action around T1. If there are strong signs of selling pressure, consider closing the remaining position.
Pay attention to any potential resistance levels or significant selling volume as price approaches your target levels.
🔑 Rationale
Price is testing a recent swing low area, which has the potential to act as support.
Increasing buying volume within the support zone suggests that buyers are stepping in.
Bullish reversal patterns on lower timeframes would confirm the rejection of the support zone.
Aiming for the previous swing high (~99.727) and the higher potential resistance (~100.116) provides logical profit targets.
⚡ Highlight:
This is a bank-order-flow style fade, looking to buy at a potential support zone after a recent pullback, anticipating a reversal and continuation of potential upward momentum. The increasing buying volume within the support zone is a key observation.

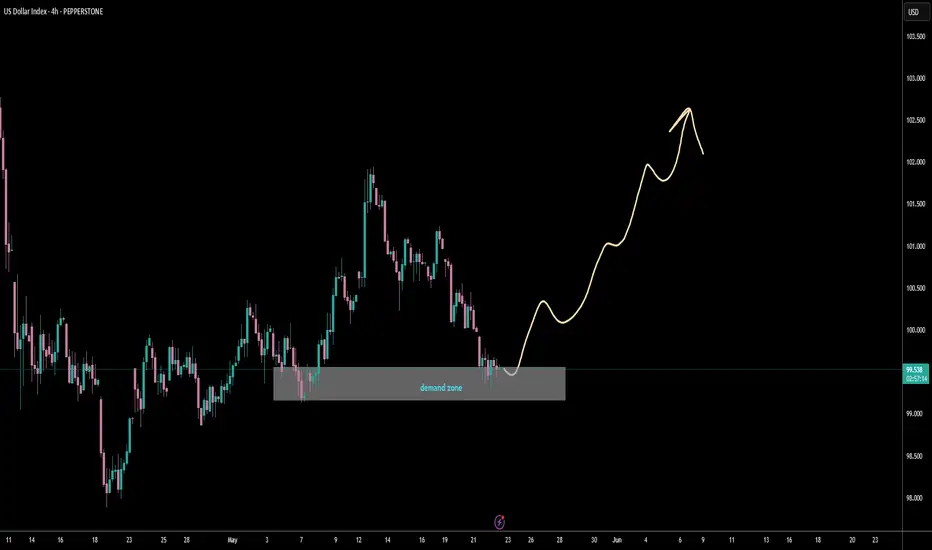
USDX retesting demand ZONEcan dollar strength return around here over next little while?!
TDA
D1 W1 DEMAND ZONE of interest
price structure building upside move by confluenced levels of lTF's
can price shake the tree to downside sure and go lower deeper into w1 demand yes times frame dependent of this set up
- to play out is a few weeks for completion.

Weekly FOREX Forecast: USD, EUR, GBP, AUD, NZD, CAD, CHF, JPYThis is the FOREX Currency futures outlook for the week of May 18 - 24th.
In this video, we will analyze the following FX Majors markets:
USD Index
EUR
GBP
AUD
NZD
CAD
CHF
JPY
USD Index has been bullish for 4 weeks. Will it continue? Expect a pullback before bullish continuation.
Selling the commodity currencies (AUD, CAD, NZD) may be the best course of action this week. Buying the EUR, GBP and CHF may also be worthwhile.
Enjoy!
May profits be upon you.
Leave any questions or comments in the comment section.
I appreciate any feedback from my viewers!
Like and/or subscribe if you want more accurate analysis.
Thank you so much!
Disclaimer:
I do not provide personal investment advice and I am not a qualified licensed investment advisor.
All information found here, including any ideas, opinions, views, predictions, forecasts, commentaries, suggestions, expressed or implied herein, are for informational, entertainment or educational purposes only and should not be construed as personal investment advice. While the information provided is believed to be accurate, it may include errors or inaccuracies.
I will not and cannot be held liable for any actions you take as a result of anything you read here.
Conduct your own due diligence, or consult a licensed financial advisor or broker before making any and all investment decisions. Any investments, trades, speculations, or decisions made on the basis of any information found on this channel, expressed or implied herein, are committed at your own risk, financial or otherwise.


DXY BUYBy utilizing Fibonacci retracement levels, historical patterns, , we can formulate a hypothesis that the market might follow a similar trajectory if bullish sentiment prevails.


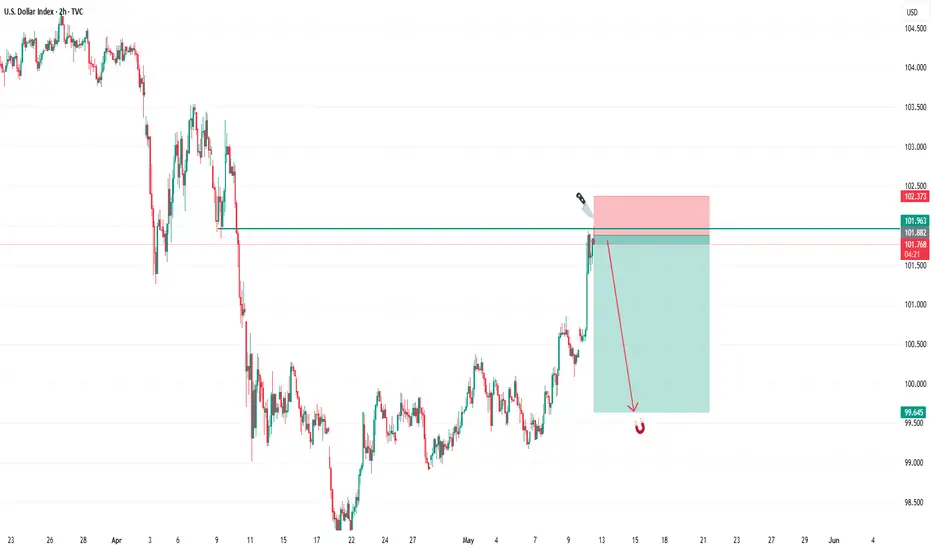
SELL USDIn todays session we are monitoring DXY for sells. After big move up we expect trend to continue. Our entry is at 101.82 and stops above 102.373. Targets are below 99.600 and lower to 95.00 . USD pairs will be dropping. Use proper risk management. Cheers to you all.
DOLLARDXY (US Dollar Index) and Bond Yield Relationship – May 2025
Current Market Situation
US Treasury Yields:
The 10-year Treasury yield is at 4.54% (May 21, 2025), and the 30-year yield is testing the 5% level amid a global bond sell-off.
DXY (US Dollar Index):
The DXY and the 10-year yield are moving in sync again after a period of divergence earlier in 2025.
Relationship Dynamics
Positive Correlation:
Historically, the DXY and US bond yields (especially the 10-year yield) tend to move together. When yields rise, the dollar often strengthens, as higher yields attract foreign capital seeking better returns.
In recent weeks, this positive correlation has resumed after a brief disconnect in April, when yields surged but the dollar weakened due to shifting investor sentiment and US tariff policy.
Periods of Divergence:
In early April 2025, there was a notable divergence: yields climbed while the dollar fell, reflecting a rare episode where investors were wary of US assets despite higher returns, possibly due to concerns about US fiscal health and global trade tensions.
During that period, both US bonds and the dollar declined together, signaling a potential shift away from US assets and raising questions about the dollar’s structural appeal as a reserve currency.
Recent Realignment:
After the Federal Reserve’s recent meeting and a major tariff agreement with China, the DXY and yields began rising together again, indicating renewed confidence in US assets and a return to more typical market behavior.
Key Factors Influencing the Relationship
Fed Policy:
Expectations for future rate cuts or hikes directly influence both yields and the dollar. Higher expected rates generally support both.
Global Risk Sentiment:
In risk-off scenarios, the dollar can strengthen even if yields fall, due to safe-haven demand.
Trade and Fiscal Policy:
Tariffs and concerns about US debt sustainability can disrupt the usual correlation, as seen in early 2025.
Summary Table
Factor Impact on DXY Impact on Yields Typical Correlation
Rising US Yields Strengthens DXY Yields rise Positive
Fed Rate Hike Expectations Strengthens DXY Yields rise Positive
US Fiscal Concerns Can weaken DXY Yields may rise Can diverge
Global Risk Aversion Strengthens DXY Yields may fall Can diverge
Trade Tensions/Tariffs Mixed Mixed May disrupt correlation
Conclusion
As of May 2025, the DXY and US bond yields have resumed a positive correlation, both rising in response to Fed policy signals and improved risk sentiment following a major tariff agreement. However, earlier in the year, this relationship broke down due to concerns about US fiscal stability and shifting global investment flows. The interplay between DXY and yields remains sensitive to Fed policy, fiscal outlook, and geopolitical developments.
#DOLLAR #DXY

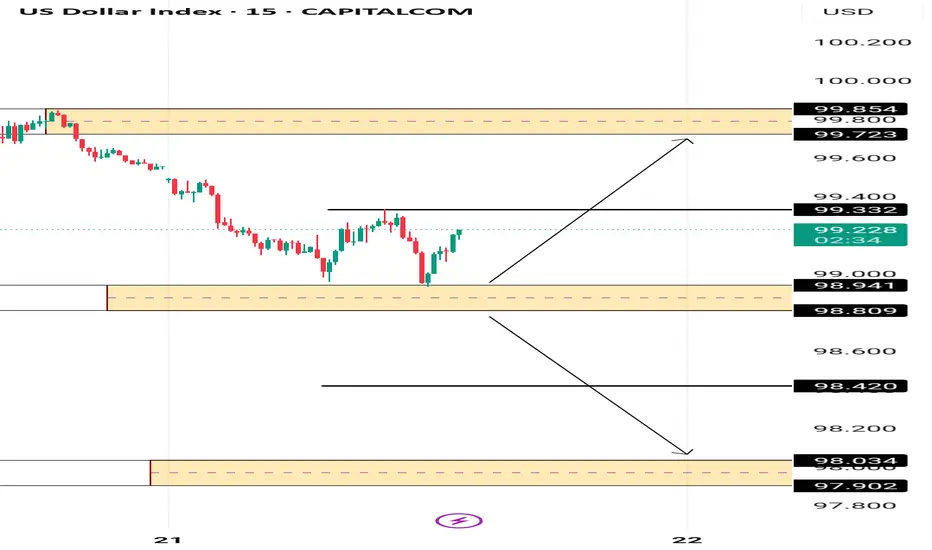
USD INDEX PIVOT AREA INTRADAYUSD Index is bouncing off a pivot area with possible correction to the upside , we are currently in a downtrend on bigger time frames.
However a break of the Pivot area to the downside could bring prices to 98.42 and 98.03.
DXY more down?My vision where going price this week.
Question is does wave C finnish already or not.
Area 100.00 is important if break down then we first fall to 99.5 or we cant broke that zone we go up to close Gap.
For my opinion bearish correction continue.
DXY Bearish Setup: Sell from Supply Zone to 99.100 TargetTrend: 📉 Bearish Bias
Key Zones & Strategy:
🔶 Supply Zone (Sell Area)
📍 100.584 – 100.906
⚠️ Price may face selling pressure here
🔵 Entry Point:
🎯 100.584 (bottom of supply zone)
🔴 Stop Loss:
❌ 100.906 (just above resistance)
🟢 Target Point:
✅ 99.100
📉 Aligned with lower support line
Technical Indicators:
📏 Descending Channel
🔽 Price moving within parallel downward trend lines
📊 EMA (70) – Orange Line
🔁 Acting as dynamic resistance
Trade Setup Summary:
📌 Sell in the Supply Zone
🛑 Stop Loss: 100.906
🎯 Target: 99.100
⚖️ Good Risk-Reward Ratio
Warnings & Tips:
⚡ Watch for Breakouts:
If price breaks above 100.906 ➡️ 📈 Bearish idea invalid
📰 Check News Events:
FOMC, CPI, or other USD events may cause volatility

DOLLAR I Weekly CLS I Model 2- Target CLS HighHey, Market Warriors, here is another outlook on this instrument
If you’ve been following me, you already know every setup you see is built around a CLS range, a Key Level, Liquidity and a specific execution model.
If you haven't followed me yet, start now.
My trading system is completely mechanical — designed to remove emotions, opinions, and impulsive decisions. No messy diagonal lines. No random drawings. Just clarity, structure, and execution.
🧩 What is CLS?
CLS is real smart money — the combined power of major investment banks and central banks moving over 6.5 trillion dollars a day. Understanding their operations is key to markets.
✅ Understanding the behaviour of CLS allows you to position yourself with the giants during the market manipulations — leading to buying lows and selling highs - cleaner entries, clearer exits, and consistent profits.
🛡️ Models 1 and 2:
From my posts, you can learn two core execution models.
They are the backbone of how I trade and how my students are trained.
📍 Model 1
is right after the manipulation of the CLS candle when CIOD occurs, and we are targeting 50% of the CLS range. H4 CLS ranges supported by HTF go straight to the opposing range.
📍 Model 2
occurs in the specific market sequence when CLS smart money needs to re-accumulate more positions, and we are looking to find a key level around 61.8 fib retracement and target the opposing side of the range.
👍 Hit like if you find this analysis helpful, and don't hesitate to comment with your opinions, charts or any questions.
⚔️ Listen Carefully:
Analysis is not trading. Right now, this platform is full of gurus" trying to sell you dreams based on analysis with arrows while they don't even have the skill to trade themselves.
If you’re ever thinking about buying a Trading Course or Signals from anyone. Always demand a verified track record. It takes less than five minutes to connect 3rd third-party verification tool and link to the widget to his signature.
"Adapt what is useful, reject what is useless, and add what is specifically your own."
— David Perk aka Dave FX Hunter ⚔️

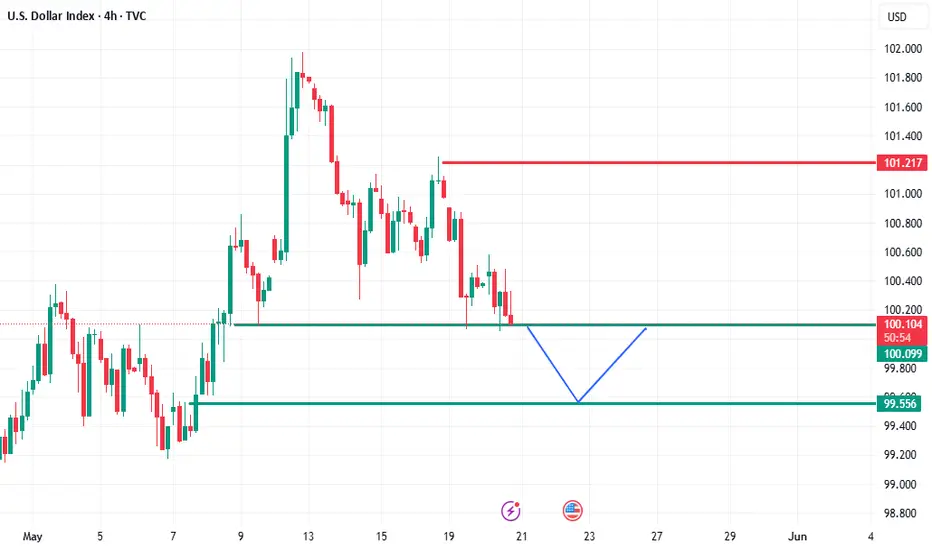
DXY trade oulook.We have currently shifted structure to the bulls. Change of character @ 100.280, now we coming back for a retest of the OB/demand @ 99.910. Just above 99.910 we have equal lows/ liquidity ($). Once swept, looking for bullish sentiment to go long. If nothing comes, we will continue going down.
possibility of correctionAccording to the behavior of the index in the current support range, possible scenarios have been identified. As long as the index fluctuates above the green support range, the uptrend will be probable. Otherwise, the continuation of the downtrend will be possible.

DXY watch 99.69: interesting number and a Major Fib for support DXY has been all over the place thanks to Trump.
That latest dip wave has hit a major fib at $99.69
This should offer some support if not a bottom.
We all know the implications of DXY movements.
Gold, Stocks, Crypto, all orbit the mighty Dollar.
Bulls need to mount a defense here and right now.
=============================================
