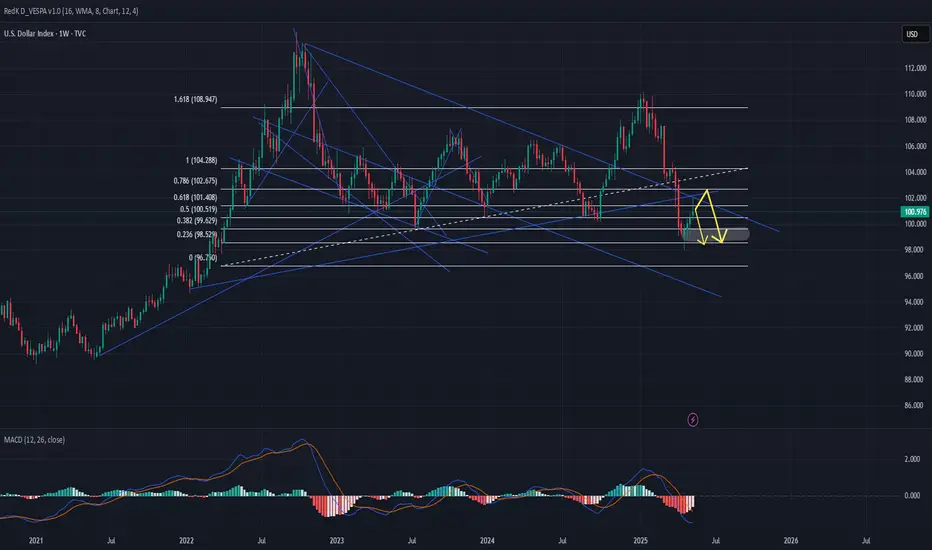
DXY CorrectionMy vision where going price next week.
Question is does wave B finnish already or not.
Monday we will see about Wave B going higher or price move down to wave C.
TA show down but FA talk that dollar must rise.
Area 100.3 is trend zone
For my opinion bearish correction continue.
DOLLARINDEX trade ideas

Check the trend The correction is expected to continue until the red support zone. Then there is a possibility of a trend change and the start of an uptrend. Otherwise, a continuation of the downtrend is likely.

Mindset Monday - Dealing With Big Losses “You can’t control if you lose — but you can control how much you lose.”
In this first episode of Mindset Mondays, we dive into the emotional and practical side of trading losses. I explore how risk management and mindset shape your long-term success, and why learning to accept and limit losses is one of the most powerful skills a trader can develop.
Whether you're dealing with a tough loss or want to build mental resilience before the next one hits, this video is for you.
🎥 Watch now and take control of what is in your control.

Bullish bounce?US Dollar Index (DXY) is falling towards the pivot and could bouce to the 1st resistance.
Pivot: 100.17
1st Support: 97.91
1st Resistance: 101.93
Risk Warning:
Trading Forex and CFDs carries a high level of risk to your capital and you should only trade with money you can afford to lose. Trading Forex and CFDs may not be suitable for all investors, so please ensure that you fully understand the risks involved and seek independent advice if necessary.
Disclaimer:
The above opinions given constitute general market commentary, and do not constitute the opinion or advice of IC Markets or any form of personal or investment advice.
Any opinions, news, research, analyses, prices, other information, or links to third-party sites contained on this website are provided on an "as-is" basis, are intended only to be informative, is not an advice nor a recommendation, nor research, or a record of our trading prices, or an offer of, or solicitation for a transaction in any financial instrument and thus should not be treated as such. The information provided does not involve any specific investment objectives, financial situation and needs of any specific person who may receive it. Please be aware, that past performance is not a reliable indicator of future performance and/or results. Past Performance or Forward-looking scenarios based upon the reasonable beliefs of the third-party provider are not a guarantee of future performance. Actual results may differ materially from those anticipated in forward-looking or past performance statements. IC Markets makes no representation or warranty and assumes no liability as to the accuracy or completeness of the information provided, nor any loss arising from any investment based on a recommendation, forecast or any information supplied by any third-party.

Sunday Viper Weekly breakdown May18Sunday's we break down the market going over upcoming news and take a forward look at developing chart patterns and strategy build ups

BTC's Last Shot at reversal?With the DXY in the overbought range on the RSI it looks like bitcoin could bounce, but is that it? Looking very bearish, but something in my gut says it could boom soon... Just a simple guess!

Retrace to 98ish before liftoffExpecting a retrace to the 98 range before a pump to the 118ish range

DXY 1H Outlook: Bullish Bias for the Week AheadThe DXY 1-hour chart is showcasing a bullish trend as we approach the upcoming week. Traders should monitor the 1-hour chart for potential entry points that align with this bullish trend. As always, it's crucial to manage risk appropriately and stay informed about any economic events that could impact the dollar's performance.


May 19–23, 2025GOLD (XAU/USD)
🔑 Key levels:
Resistance: $3,250 – $3,280
Strong Support: $3,150 – $3,120 | $3,050 (a breakdown could push lower)
🗓️ Important News:
FOMC Minutes (Wednesday, May 21) – market will react to tone regarding inflation and rate policy.
US Manufacturing & Services PMI (Thursday, May 22)
🎯 Strategy:
If gold dips to the $3,120–$3,150 zone, consider short-term buying, targeting a move back to $3,250.
A break below $3,100 may signal a sell opportunity, targeting $3,050 or lower.
A breakout above $3,280 → consider buying the breakout. Avoid trading in the chop zone ($3,200–$3,250) unless clear momentum.
💵 USD Index (DXY)
🔑 Key levels:
Resistance: 104.50 – 105.00
Key Support: 103.20 – 102.80
🗓️ Important News:
FOMC Minutes (high impact)
U.S. Housing data, PMI, Durable Goods Orders
🎯 Strategy:
DXY is showing weakness. A break below 103.20 would suggest further USD weakness → bullish for gold and EUR/USD.
If DXY bounces from 103.20 → short-term recovery likely → possible correction in risk assets.
EUR/USD setup: consider buying on a breakout above 1.1000 targeting 1.1200.
📈 U.S. Stock Indices (S&P 500, NASDAQ)
🔑 Key Levels (S&P 500):
Resistance: 5,300 – 5,350 (near all-time highs)
Support: 5,200 – 5,150
🗓️ Important News:
FOMC Minutes – could cause major volatility
Possible speech from Fed Chair Powell
ETF flows and any remaining earnings reports
🎯 Strategy:
If S&P holds above 5,200 → maintain buy on dips strategy.
A break below 5,150 → opens risk for a deeper pullback toward 5,000.
Maintain long positions as long as markets price in rate cuts in Q3.
✅ Weekly Strategy Summary:
Market Primary Strategy Key Levels to Watch
Gold Buy around $3,120–$3,150 Support $3,120 – Resistance $3,280
USD (DXY) Sell if it breaks below 103.20 Support 103.20 – Resistance 104.50
S&P 500 Buy on dips above 5,200 Support 5,150 – Resistance 5,300–5,350

DXY - Dollar Index AnalysisThe U.S. Dollar Index (DXY) remains in a bearish zone, as indicated by the current weekly chart. There is potential for further downside movement toward the 99.70 level, which serves as a strong support area. If this level is breached, the next key support could be found near 98.56.
Alternatively, the index may experience a short-term correction to the upside. A breakout above 101.40 could trigger a move toward the 102.40 resistance level. However, this upward movement is likely to be limited, and the broader trend suggests a probable return to bearish momentum, potentially driving the index back down toward 98.56.
DXY weekly outlookWeekly analysis for DXY: the broader bias remains bullish. I expect price to respect the stacked 3‑hour demand zones, with the lower zone likely providing the stronger reaction.
After that bounce, a short‑term bearish pullback could unfold from the 4‑hour supply zone. Although I don’t trade the dollar directly, I track DXY for its correlations with other pairs to add confluence and strengthen my setups.

DXY (Timeframe synchronization + BOS + Orfer Flow + Supply)Hello Traders!
Our previous supply was mitigated, now we have confirmation + supply zone, there we can expect reversal on LTF.
Have a profitable day and don't forget to subscribe for updates!

Analysis of the dollar indexHello friends, I'm back.
I think the dollar index will follow the path indicated on the weekly time frame.
You can keep this scenario in mind for your trading.
be profitable.

US Dollar Index ForecastSeasonal Tendecny - March,April, May= Bullish
Weekly Nearby
Open Interest - Dropping
Williams%R - Oversold
COT - Increasing Longs
Month - Bullish
Weekly - Bullish
Daily - Bullish
4H - Bullish
30M - Retracment
15M - Catch ChoCh+
5M -

My Thoughts #008Well the pair could still buy after the sweep
Of the liquidity on the 1D Demand Zone.
Yet we will buy after we get a choch on the demand zone and sweep liquidity
The pair could invalidate the set up
And continue selling so use proper risk management
Let's do the most

STRAP IN FOR A TURBULENT WEEK DXY- USD INDEX FORECAST Q2 W21 Y25DXY USD INDEX FORECAST Q2 W21 Y25
Professional Risk Managers👋
Welcome back to another FRGNT chart update📈
Diving into some Forex setups using predominantly higher time frame order blocks alongside confirmation breaks of structure.
✅ U.S. dollar index is a measure of the value of the dollar against a basket of six foreign currencies.
✅The currencies are the Euro, Swiss franc, Japanese yen, Canadian dollar, British pound, and Swedish krona.
💡Here are some trade confluences📝
✅ Break an d close below July 2023 key 100.00 levels.
✅ Foresee a pull back to, weekly imbalance, daily order block, daily 50ema, weekly order block and or weekly 50 ema.
✅ Awaiting to identify a significant break of structure bullish to use the DXY as confluence for our trading week 18 of Q2 toward key points of interest mentioned above.
✅ Forecasting continued bearish pressure long term.
✅Initially bullish outlook however upon price turn around. DXY to break 100.000 level again.
🔑 Remember, to participate in trading comes always with a degree of risk, therefore as professional risk managers it remains vital that we stick to our risk management plan as well as our trading strategies.
Pairs to look out for -
EURUSD
USDCHF
USDJPY
USDCAD
GBPUSD
Simply an opinion -
We always trade what we see and not what were think BUT, with that said it just feels... Unnatural to place too many bets against the USD. For that reason, our points of interest are not based on order black from too far in the distant weeks and month. We have identified more conservative targets for the DXY for the week 21 in Q2.
We foresee that with the deals that have been brokered alongside the steadiness of USD market sentiment, THE DXY MAY RISE AGAIN.
We forecast continued bearish sentiment of the DXY to the key points of interest area 98.000, weekly lows/daily lows BEFORE creating a monthly higher high inline with USD strength and Trumps seeks to sure up US ambitions.
📈The rest, we leave to the balance of probabilities.
💡Fail to plan. Plan to fail.
🏆It has always been that simple.
❤️Good luck with your trading journey, I shall see you at the very top.
🎯Trade consistent, FRGNT X

DOLLAR INDEXNews played a big part in the dollar tapping into that monthly fair value gap , looking for a rally up from the dollar index for the new week .

DXY Weekly ForecastDXY Weekly Forecast
- make sure to look for total down move when price reached 103.5 zone level
- in any case DXY has to come down to 96.000 level
"I Found the Code. I Trust the Algo. Believe Me, That’s It."

Stronger Dollar = BTC Weakens | Weak Dollar = BTC PeaksStronger Dollar (DXY), BTC & crypto weakens.
Weak Dollar (DXY), BTC & crypto Peaks.
These are not random patterns.
Macro forces are at play.
The outcome is clear. (Massive Bullrun)
$DXY Dump Incoming? What’s Next for Cryptos!TVC:DXY Dump Incoming? What’s Next for Cryptos!
The fractals in the chart are insane and indicate a drop in the U.S. Dollar Index (DXY) that can fuel significant moves in the crypto market:
Bitcoin & Altcoins Surge:
As the dollar weakens, cryptocurrencies become more attractive, expecting strong rallies in BTC and altcoins.
Commodities Rise:
Gold, silver, and oil typically gain, making crypto a competitor in the “store of value” race.
Risk-On Sentiment:
Investors shift to riskier assets like crypto, increasing prices.
Global FX Shift:
Other currencies gain strength, making crypto a go-to asset for global investors.
Bottom line: When the dollar drops, crypto thrives.
Like and repost if you agree! Bookmark for future posts!

Trump's dollar disregardUpdated version of my chart from 2022, whereby we predicted the rising strength of TVC:DXY to fill out the channel forecasted. Gold pumping to ATH's with increased political uncertainty throughout the globe and China dumping its US treasuries i am surprised the dollar has held sustained this price.
Here present is some technical analysis outlining the key levels for $TVC:DXY. Keeping this text short i am predicting the decline of the Dollar and i am currently keeping my eye on the GBP/USD chart alongside NOK/USD as see these as the most interesting in the FX markets.

DOLLARDollar (DXY) Outlook: Bearish Near-Term, Consolidation with Mild Depreciation
Current Trends: The U.S. dollar has weakened 8.4% year-to-date, pressured by:
Economic Contraction: Q1 2025 GDP shrank by 0.3%, driven by pre-tariff import surges and softening domestic demand.
Fed Policy Uncertainty: Mixed signals on inflation control and delayed rate cuts erode confidence.
Trade Tensions: Escalating U.S. tariffs disrupt global markets, favoring alternatives like the euro as a safe haven.
Technical Momentum: Bearish chart patterns suggest further downside, with key support levels at risk.
Reserve Currency Status: Despite concerns, the USD retains 57.8% of global reserves, providing a floor against rapid declines.
Treasury Yields and Recession Signals
Yield Levels
10-year: 4.439%
2-year: 3.976%
30-year: 4.900%
Inverted Yield Curve: The 10-2 spread remains negative, a historically reliable recession indicator. Past inversions preceded downturns by 18–92 weeks, signaling heightened recession risks.
Implications for USD:
Inverted curves typically weaken the dollar as markets price in future Fed rate cuts.
Rising long-term yields (e.g., 10-year at 4.439%) paradoxically coincide with dollar weakness, reflecting investor skepticism about U.S. economic resilience.
Key Drivers and Cross-Currency Impacts
Factor Impact on USD Impact on Yields
Fed Policy Uncertainty ↓ (Delayed cuts weigh) ↑ (Volatility in rate expectations)
Trade Tariffs ↓ (Safe-haven flows to EUR) ↑ (Risk premium in long-term yields)
Inverted Yield Curve ↓ (Recession fears) – (Historically precedes recessions)
Eurozone Growth (0.4% Q1) ↓ (EUR strength pressures USD) –
Conclusion
The U.S. dollar faces a bearish near-term bias, driven by economic softness, tariff headwinds, and technical breakdowns. Treasury yields, particularly the inverted curve, reinforce recession risks and further USD downside. However, the dollar’s reserve status and higher relative rates (vs. peers like the euro and yen) may limit severe declines, favoring consolidation with mild depreciation.
Watch for:
Fed communication on rate cuts and inflation.
Eurozone PMI data (May 22) to gauge EUR resilience.
10-2 yield spread dynamics for recession timing clues.
In summary, the dollar’s trajectory hinges on balancing recession risks against its yield advantage, with bears currently in control.
