what ifdxy view i just want to leave there for my lulz and see what happens in a couple years so i can lol at myself yet again
DOLLARINDEX trade ideas

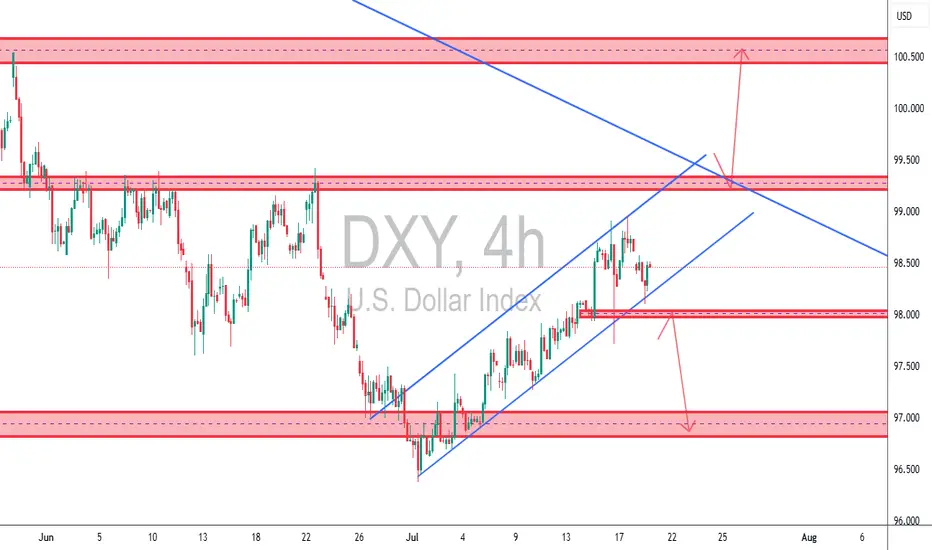
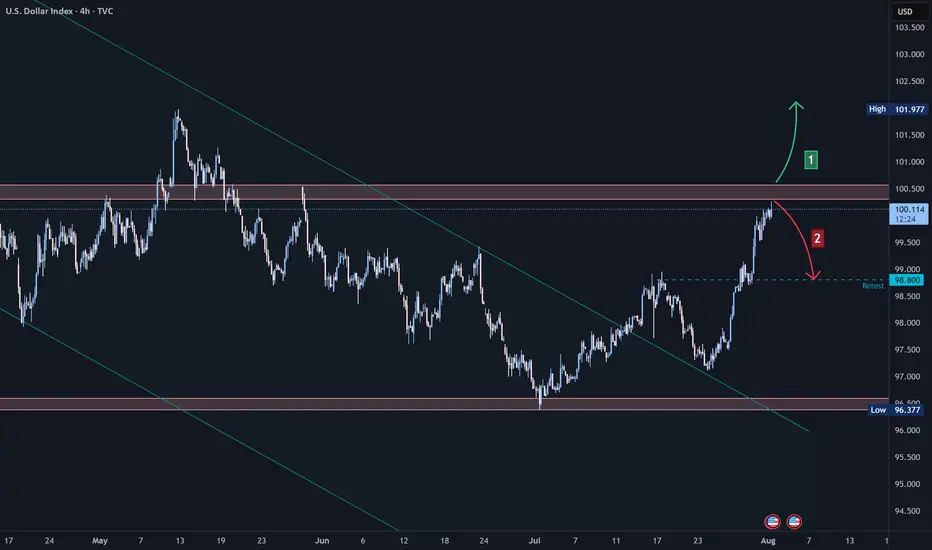
TCB Strategy Application on DXY 4H✅ TCB Strategy Application on DXY 4H
🔹 Trend → Countertrend → Breakout Structure:
• Trend: We’ve had a bullish recovery from the 97.00 zone (bottom demand), moving within an ascending channel.
• Countertrend Zone: Price has now pulled back from the 99.00–99.200 supply area.
• Breakout Watch:
o A break below the ascending channel (support line) + 98.00 zone would signal countertrend breakout → opens potential for 97.000 retest.
o A break above 99.200 would be a bullish breakout targeting the 100.500–101.000 macro supply zone.
________________________________________
🔄 What This Means for Dollar Pairs (Especially XAUUSD):
🟥 Scenario 1: Bearish DXY Breakout (98.00 loss)
• Expect XAUUSD bullish continuation, possibly reclaiming upside zones (especially if DXY targets 97.00).
• GBPUSD, EURUSD, etc., likely to gain against USD.
🟩 Scenario 2: Bullish DXY Breakout (Above 99.200)
• XAUUSD may reject from resistance or fall back toward support zones.
• USD strength will put pressure on GBPUSD, EURUSD, and other majors.
________________________________________
🧠 TCB Notes:
• Checklist Score (Pre-Breakout): ~75%
o ✔ Structure zones marked
o ✔ Channel support tested
o ✔ Reaction to supply zone
o ✖ Awaiting breakout candle + NY session confirmation
________________________________________
🔔 Suggested Alerts (Set in TradingView):
• DXY Breakout Alert: 98.00 (bearish trigger)
• DXY Bullish Trigger Alert: 99.20 or trendline breakout
• Match these alerts with corresponding TCB setups on XAUUSD, GBPUSD, etc.
DXY 4Hour TF - July 20th, 2025DXY 7/20/2025
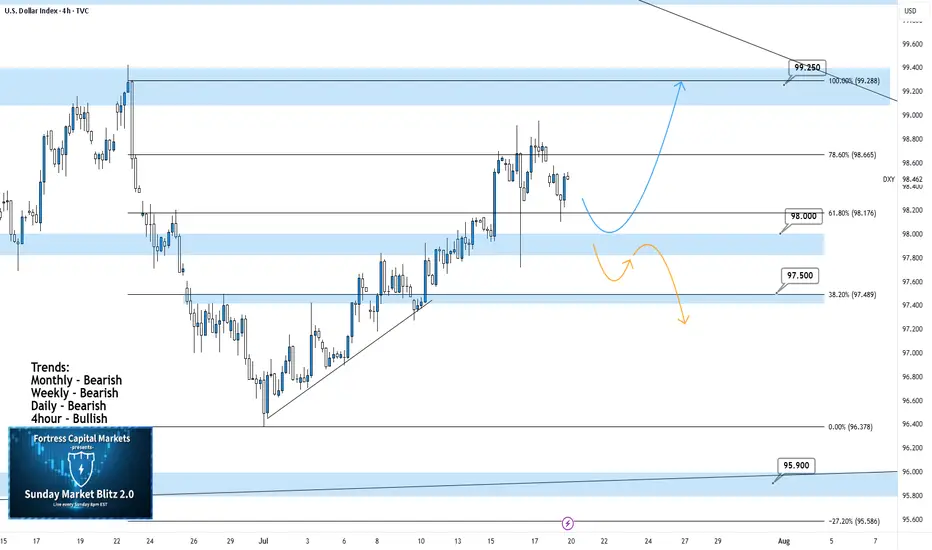
DXY 4hour Neutral Idea
Monthly - Bearish
Weekly - Bearish
Dailly - Bearish
4hour - Bullish
Higher timeframe trend analysis suggests that DXY is primarily bearish and is currently retracing to potential resistance.
Going into this week we are looking to see if our 98.000 zone will stay as support or transition into resistance. Here are two scenarios which highlight both a bullish and bearish outcome:
Bullish Continuation - Last week we saw a strong rally through our 98.000 zone which seems to still be holding. If this 4hour bullish trend is to continue we would like to see some sort of rejection off 98.000 support while also confirming a higher low. If this happens look to target higher toward major resistance levels like 99.250.
Bearish Reversal- If we are to consider DXY bearish again on the 4hour we would need to see a break below 98.000 support and confirm this level as new resistance.
There are a few major support levels to watch out for but DXY has the potential to fall dramatically if we see price get below 97.500.
DXY is on real powerful uptrend!hi all. for who wants to know the Long Term Direction of the market, DXY is the key. market end the retrace leg and will jump up. As you see the Tariffs effect Started and in quote of President Trump, MAGA. be happy and have a powerful trade (wink)

DXYDXY still have some more upside, let the market correct and push up further.
Disclosure: We are part of Trade Nation's Influencer program and receive a monthly fee for using their TradingView charts in our analysis.
USD Is Still Bullish! Wait For Buys!Welcome back to the Weekly Forex Forecast for the week of July 21-25th.
In this video, we will analyze the following FX market:
USD
The DXY has run bullish last week, up into an area of Supply, where the momentum hesitates now. Next week may pull back a bit... before continuing higher to the buy side liquidity.
Look out for the short term pullback to the W +FVG for a high probability move higher!
Enjoy!
May profits be upon you.
Leave any questions or comments in the comment section.
I appreciate any feedback from my viewers!
Like and/or subscribe if you want more accurate analysis.
Thank you so much!
Disclaimer:
I do not provide personal investment advice and I am not a qualified licensed investment advisor.
All information found here, including any ideas, opinions, views, predictions, forecasts, commentaries, suggestions, expressed or implied herein, are for informational, entertainment or educational purposes only and should not be construed as personal investment advice. While the information provided is believed to be accurate, it may include errors or inaccuracies.
I will not and cannot be held liable for any actions you take as a result of anything you read here.
Conduct your own due diligence, or consult a licensed financial advisor or broker before making any and all investment decisions. Any investments, trades, speculations, or decisions made on the basis of any information found on this channel, expressed or implied herein, are committed at your own risk, financial or otherwise.

DXY Potential DownsidesHey Traders, in the coming week we are monitoring DXY for a selling opportunity around 99.000 zone, DXY is trading in a downtrend and currently is in a correction phase in which it is approaching the trend at 99.000 support and resistance area.
Trade safe, Joe.
DOLLAR INDEX TO COMPLETE WAVE 5 TARGET at 98.866In this short video I dive into the technical breakdown of the U.S. Dollar Index (DXY) as it approaches the anticipated Wave 5 surge, aiming for the key resistance level of 98.866. Using Elliott Wave Theory, this analysis maps out the market’s current structure on the 4 hours timeframe, highlights critical pivot zones, and projects the bullish momentum that could reshape short-term outlooks. Whether you're a seasoned trader or a curious observer, this chart-driven insight offers clarity in the wave progression and what might come next.

DXYDXY refers to the U.S dollar index ,an index that measures the value of united state dollar relative to a basket of six major foreign currencies ,it was originally developed by FED'S
THE SIX MEJOR CURRENCIES ARE ;
.euro,japaneses yen, pounds sterling, Canadian dollar, Swedish krona,swiss franc.
the index is used by investors ,traders and economist to gauge the overall strength of the U.S dollar in a global currency markets. Its rise and fall will influence trade ,investment and monetary policy decision in fx window.
on 4hr we are rejected and i will watch market open and close on Monday for trade directional bias for the following pairs (AUDUSD,USDCAD,USDZAR,GBPUSD,EURUSD,USDJPY,XAUUSD XAGUSD,XCUUSD,BITCOIN )
NOTE;TRADING IS 100% PROBABILITY,RISK MANAGEMENT IS KEY AND GET ACCOUNTABLITY PARTENER WHO WILL BE CHECKING YOUR WORK..
#DXY #DOLLAR

DXY LONGi am looking to go long on DXY from this level of breaker block.. a possible pullback to this level we will engage on the buy and use itr as cross reference for our dollar pairs ..

DXYBack to the initial direction which is bullish momentum acoording to cot report. And I'm expectiong more continuation till maket close of before

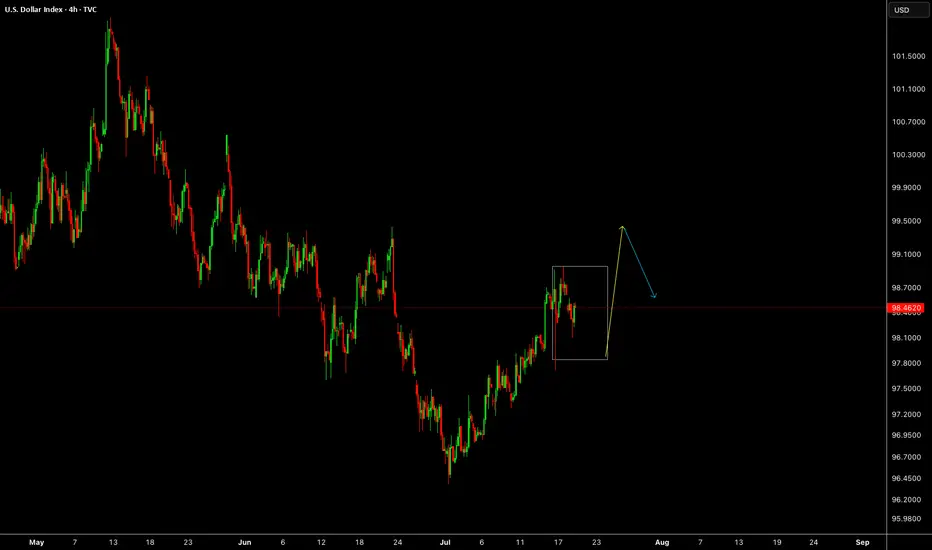
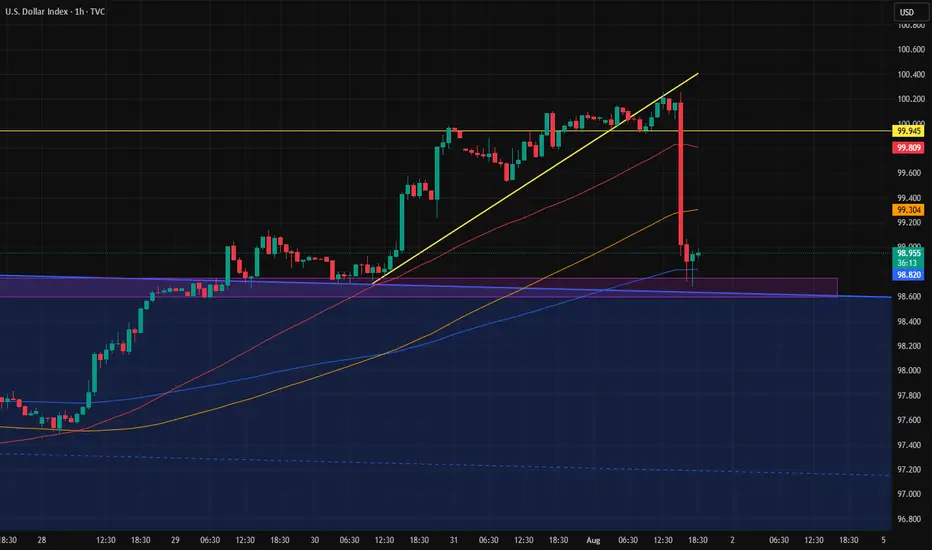
The strength of the PMI reportWe all saw how a large and strong candle formed right after the news, hitting the top of the previous channel.
So now that channel top zone has proven to be valid.
Now we have to see whether this candle leads to another drop in the dollar, or if the dollar recovers and slowly starts moving back toward 100.
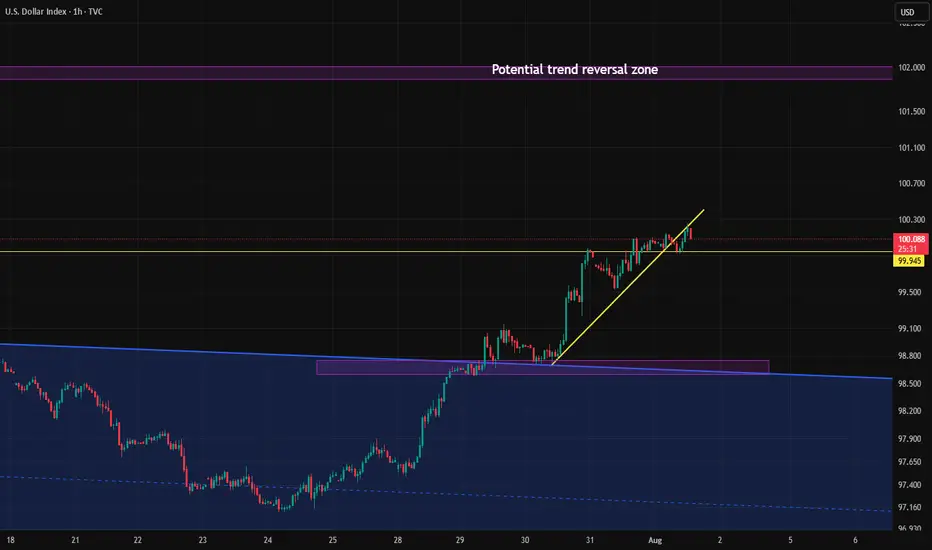
US Dollar Index (DXY) Technical Analysis:The DXY has recently exited a bearish wave, retested support levels, and began a recovery — currently trading near 100.09, a key resistance area.
🔹 If price breaks and holds above 100.09, the upward move may continue toward the 102.00 zone.
🔹 However, if the index rejects this level and reverses, a retest of 98.80 could follow.
⚠️ Disclaimer:
This analysis is for educational purposes only and does not constitute financial advice. Always perform your own analysis and monitor the markets before making any investment decisions.
DOLLAR INDEXDepartments Responsible for Each Economic Report
Indicator Responsible Department/Source
Average Hourly Earnings m/m U.S. Bureau of Labor Statistics (BLS), part of the Department of Labor
Non-Farm Employment Change BLS (Establishment Survey)
Unemployment Rate BLS (Household Survey)
Final Manufacturing PMI S&P Global/Markit (private company)
ISM Manufacturing PMI Institute for Supply Management (ISM, private sector)
ISM Manufacturing Prices Institute for Supply Management (ISM)
Revised University of Michigan (UoM) Consumer Sentiment University of Michigan (private/public university)
Construction Spending m/m U.S. Census Bureau, Department of Commerce
Revised UoM Inflation Expectations University of Michigan
How the Federal Reserve Interprets “Greater Than” or “Lower Than” Forecast
1. Average Hourly Earnings,
2.Non-Farm Payrolls,
3. Unemployment Rate
Higher than forecast (stronger labor market):
Tight labor markets (higher wages, more jobs, lower unemployment) suggest inflationary pressure.
The Fed may view this as a signal to keep rates higher for longer, as wage and job growth could fuel inflation.
Lower than forecast (weaker labor market):
Signals cooling in employment and wage growth, reducing upward pressure on inflation.
The Fed may see this as justification to consider easing policy or at least pausing further rate hikes.
2. Manufacturing PMIs (ISM, S&P)
Above 50: Signals expansion in manufacturing; below 50 indicates contraction.
Higher than forecast: Points to stronger economic momentum; the Fed may see upside risks to inflation.
Lower than forecast: Indicates weaker manufacturing activity; a possible sign of slowing demand, which could support rate cuts or dovish policy if persistent.
3. ISM Manufacturing Prices
Higher than forecast: Suggests inflationary pressures in manufacturing input costs; Fed interprets this as a reason for vigilance on inflation.
Lower than forecast: Implies easing input price pressures, supporting a dovish outlook if inflation remains subdued.
4. University of Michigan Consumer Sentiment & Inflation Expectations
Stronger than forecast sentiment: Consumers are more optimistic, often a sign of solid spending potential. May amplify inflation if this leads to greater demand.
Higher inflation expectations: If consumers expect higher future inflation, this can become self-fulfilling and the Fed may maintain tighter policy.
Weaker sentiment/lower inflation expectations: Reduces inflation risk, gives the Fed more flexibility to ease if needed.
5. Construction Spending
Higher than forecast: Indicates resilient investment and demand in the real economy.
Lower than forecast: Suggests cooling real estate and infrastructure spending; may support a dovish Fed outlook if sustained.
Summary Table
Data Surprises Interpretation for Fed Policy
Higher-than-forecast More hawkish; raises risk of persistent inflation
Lower-than-forecast More dovish; reduces pressure to hold rates higher
The Fed looks at the overall pattern across these data. Persistent upside surprises heighten concerns about inflation, supporting tighter policy. Downside surprises suggest cooling economic momentum and may encourage future rate cuts or pauses. The relative impact depends on which indicators surprise and the broader economic context.
#DXY #DOLLAR

Candle close above 100 after 2 months.If the Dollar Index manages to close above the 100 level today, following the important news release, there's a chance the upward move could continue toward the key 101 zone next week.
However, unless it breaks above the 101 level with strong momentum, the overall trend in the higher timeframes still remains bearish.
104This channel is not providing individualized trading or investment advice, nor is it a banking service, brokerage service, trading service, investment service or money management service

Range above 100.It seems like the dollar is trying to push back above the 100 level after a long time, and it's likely forming a range up there to establish stability in that zone.
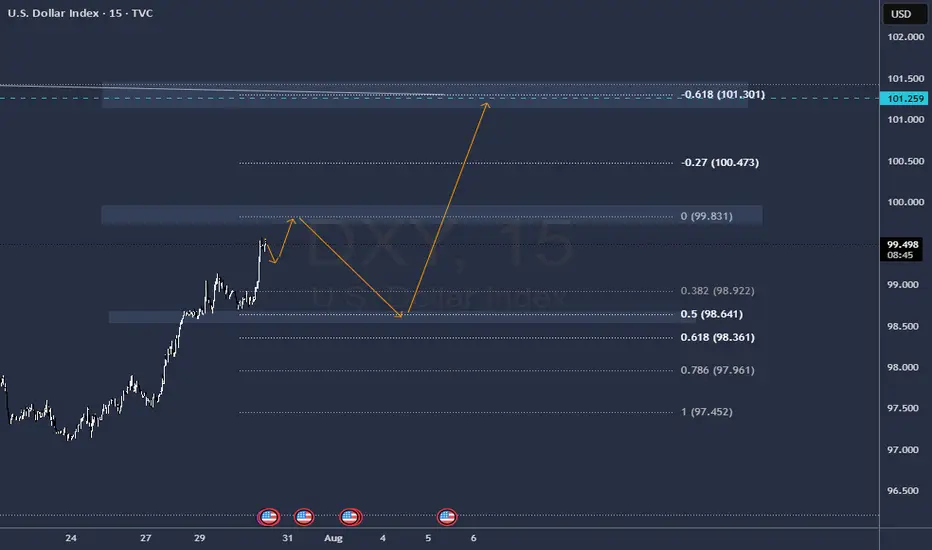
DXY Outlook – From Bias to Execution Previous day closed bullish on DXY, leading me to look out for a bullish bias, On the 1H, I identified a familiar bullish pennant forming within the uptrend.

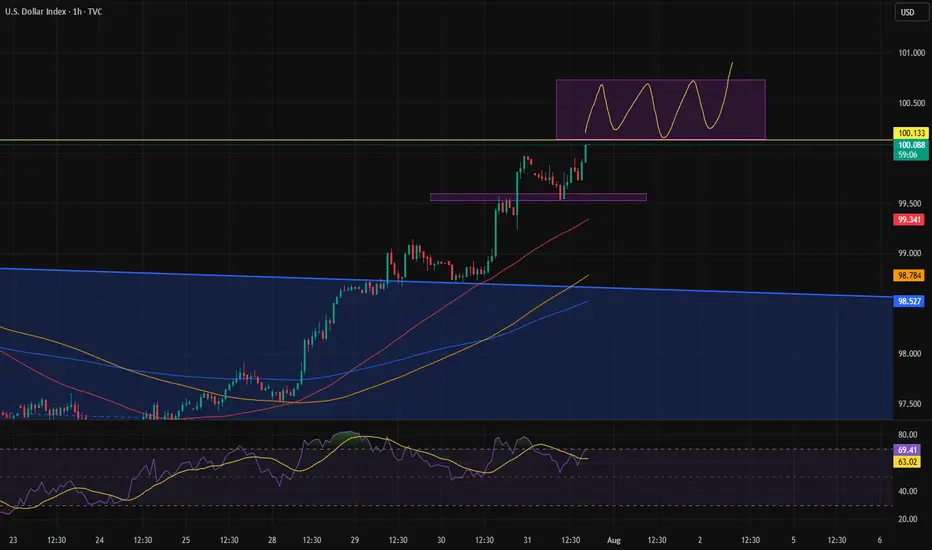
U.S. Dollar Index (DXY) – Pro Analysis | 1H Chart |1. Strong Bullish Momentum
DXY broke out sharply above the 99.41 resistance, showing clear strength from bulls with minimal pullbacks during the rally.
2. Short-Term Rejection at Supply
Price was rejected from the 99.978 zone — a key supply area. This indicates the presence of active sellers near the psychological 100 level.
3. Retesting Breakout Structure
Currently hovering just above 99.669, the DXY is retesting the previous breakout level. This could act as short-term support if bullish momentum resumes.
4. Next Key Zones
Resistance: 99.978 → 100.534
Support: 99.411 → 98.92
Break below 99.411 may invalidate the breakout.
5. Outlook
Bias remains bullish above 99.41. However, failure to reclaim 99.978 soon may signal temporary exhaustion or consolidation before next leg up.

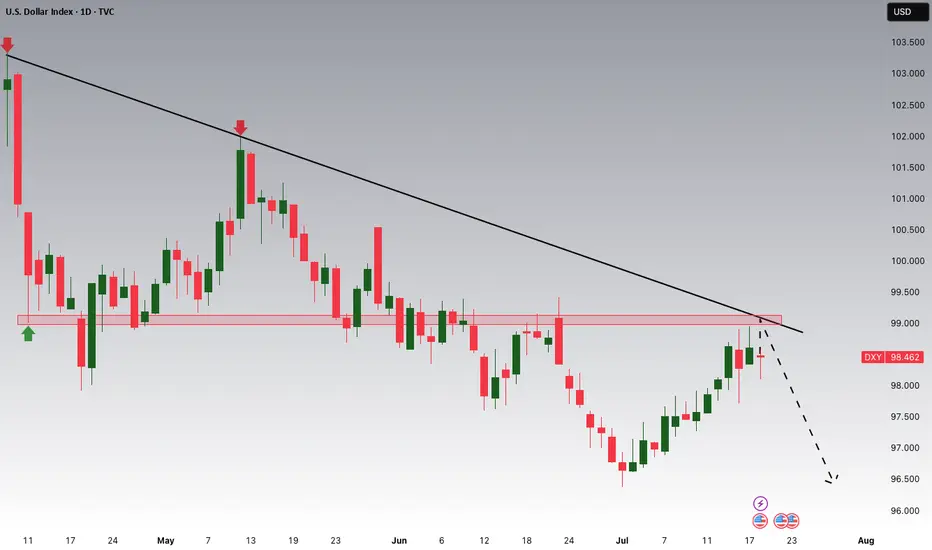
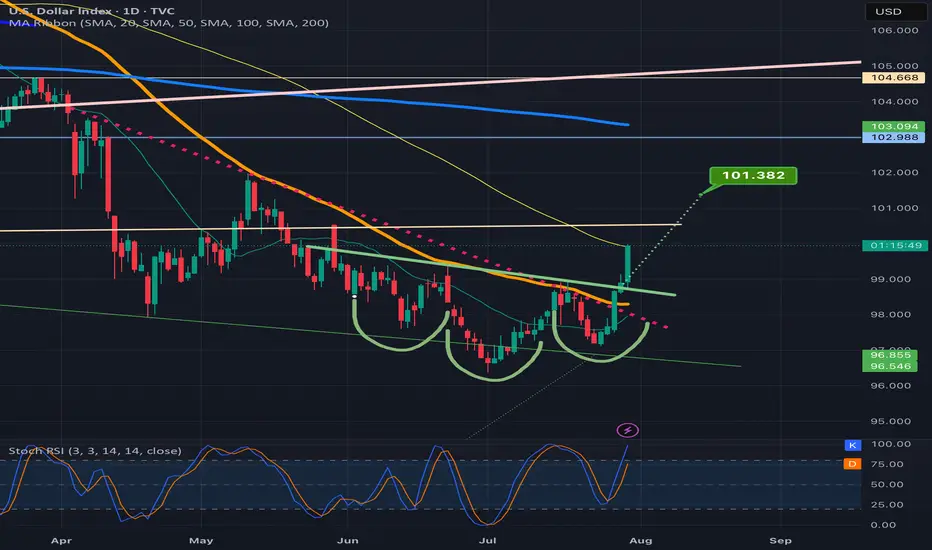
DXY attempting an inverse H&S breakoutSeeing a big green candle today on dxy after confirming the neckline of the inverse head and shoulders pattern as support on the previous daily candle.
DXY BEARISH TREND 30-JUL 15-JUN 2025There are some major upcoming events that could significantly impact the US dollar index (DXY), including the ADP Non-Farm Employment Change and the Federal Funds Rate decision. Because of this, I expect the DXY to continue its downward movement until it reaches around 94.5. If it breaks below that level, it’s also possible that it could drop further and reach 89.00.
Currently, the DXY is expected to start its move downward from the 99.20–99.50 range, making a decline from that level quite likely

DOLLAR INDEX DXYThe latest U.S. economic data released on July 30, 2025 shows:
ADP Non-Farm Employment Change: Actual increase of 104,000 jobs, significantly above the forecast of 77,000. This marks a strong rebound from the previous decline of -23,000 in June and indicates solid labor market momentum, particularly in services sectors like leisure/hospitality, financial activities, and trade/transportation. However, education and health services saw job losses. Wage growth remains steady at 4.4% year-over-year for job-stayers.
Advance GDP q/q Growth: Actual growth came in at 3.0%, beating the forecast of 2.5% and improving sharply from -0.5% previously. This suggests that the economy is expanding robustly in the second quarter
Advance GDP Price Index q/q (Inflation measure): Actual was 2.0%, slightly below the forecast of 2.2%, and down from 3.8% previously, indicating easing inflation pressures .
Interpretation of this data for Federal Reserve policy:
The stronger-than-expected job growth and GDP expansion signal a resilient economy, which may reduce the immediate likelihood of Fed rate cuts, as these indicators support sustained economic momentum.
The slightly softer inflation reading on the GDP Price Index suggests inflation pressures are continuing to moderate, which could offer some flexibility to the Fed.
Overall, the Fed is likely to view this data mix as supportive of a cautious, data-dependent approach, possibly maintaining current rates in the short term without rushing to cut, but monitoring to ensure inflation stays on a downward path.
If the Fed prioritizes strong growth and a resilient labor market, rate hikes or holds are more likely than cuts. If inflation remains subdued, it could permit a gradual easing down the line but probably not immediately.
Let me know if you want a detailed outlook on market reactions to this release or the potential Fed communication following today’s data.
#GOLD
