Nas100 1. Determine the Higher Timeframe Bias
Look at Daily & 4H charts.
Identify: Is market forming higher highs/lows (bullish) or lower highs/lows (bearish)?
2. Mark Liquidity Pools
Find equal highs/lows – where smart money will draw price to.
These often act as targets.
3. Find Displacement & Fair Value Gaps
If price made a strong move away from a level (displacement), look for a FVG on 1H/4H/Daily to see if price might retrace before continuing.
4. Use Premium/Discount Tool
From the recent swing high to low (or vice versa), divide the range.
Price in discount = buy zone; in premium = sell zone.
5. Mark Key Session Times
Focus on New York Open (8:30–11:00 am EST) – high-probability moves.
US100 trade ideas

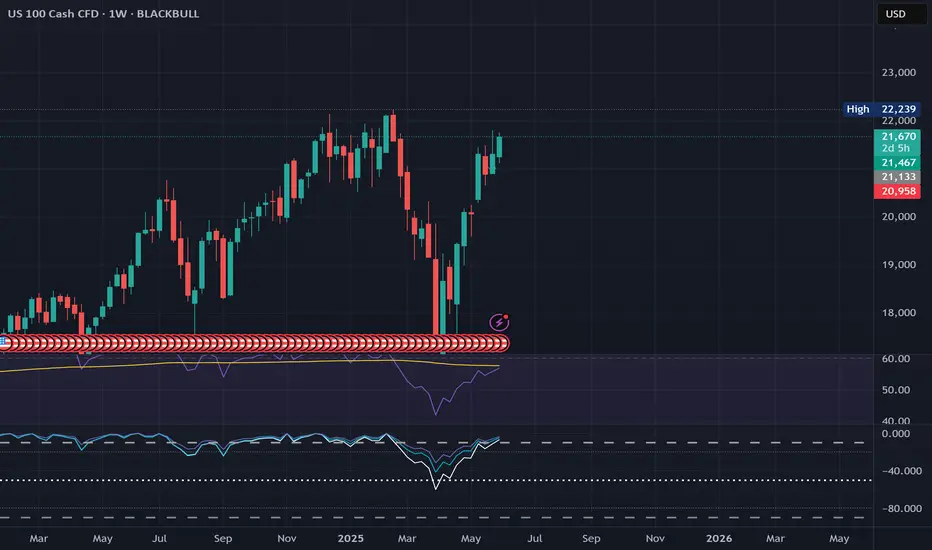
Nasdaq - The final bullrun breakout!Nasdaq - TVC:NDQ - might break above all structure:
(click chart above to see the in depth analysis👆🏻)
It is quite incredible how volatile stocks have been lately, especially considering that fact that the Nasdaq is about to create new all time highs again. Consequently, we are about to witness a significant structure breakout, which would ultimately lead to another rally of about +30%.
Levels to watch: $21.000
Keep your long term vision!
Philip (BasicTrading)

Hanzo / Nas100 15 Min Path ( Tactical Break Out Zones )🔥 Nas100 – 15 Min Scalping Analysis (Bearish Setup)
Bias: Waiting For Break Out
Time Frame: 15 Min
Entry Type: Confirmed Entry After Break Out
👌Bullish After Break : 21740
Price must break liquidity with high volume to confirm the move.
👌Bearish After Break : 21590
Price must break liquidity with high volume to confirm the move.
☄️ Hanzo Protocol: Dual-Direction Entry Intel
➕ Zone Activated: Strategic Reaction from Refined Liquidity Layer
Marked volatility from a high-precision supply/demand zone. System detects potential for both long and short operations.
🩸 Momentum Signature Detected:
Displacement candle confirms directional intent — AI pattern scan active.
— If upward: Bullish momentum burst.
— If downward: Aggressive bearish rejection.

Beautiful Market Maker on the Nasdaq this early morning.This will be an entire move downward that no one is picking up on right now. With price in the perfect sell position, we're looking to collect on the spread between greed and far like a true market maker
SELL NAS 100! TRADE WHAT YOU SEE NOT WHAT YOU FEELSell confirmations on 1 HR TF
1. Fair Value Gap retracement
2. Double top aligned with Fair Value Gap
3. If TL broken, another confirmation of a sell.
Basic trading, no stress, no complications - trade what you see and not what you feel.
Take Profit level - I am holding until Friday, but you can take profit if the money makes you smile.

SELLING NAS100 TODAY!Sell confirmations on 1 HR TF
1. Fair Value Gap retracement
2. Double top aligned with Fair Value Gap
3. If TL broken, another confirmation of a sell.
Basic trading, no stress, no complications - trade what you see and not what you feel.
Take Profit level - I am holding until Friday, but you can take profit if the money makes you smile.


NAS and Oil Down - Minimal DrawdownQuick thoughts and reasons for trades taken with almost zero drawdown
Nas Short/Oil Short Trades

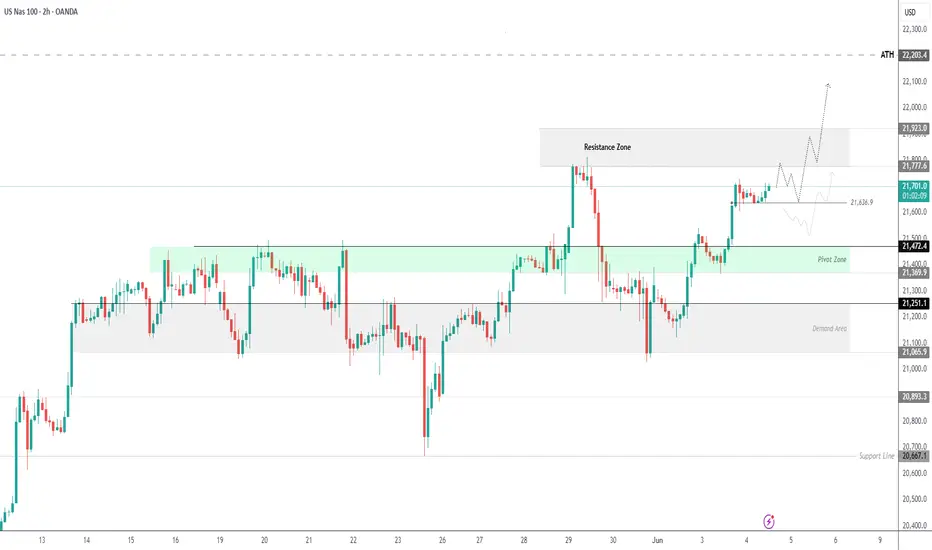
NASDAQ INDEX (US100): More Growth Ahead
For some unknown reason, I was asked by a dozen
of my subscribers to provide the update for US100.
Since early May, the index successfully updates the highs on a daily.
Such a tendency will remain at least till a test of a current ATH.
I think that the market is going to grow and reach at least 22100 level soon.
❤️Please, support my work with like, thank you!❤️

USNAS100 – Bullish Scenario Valid Above 21640, Targeting 21920USNAS100 | Technical Analysis
The price initiated a bullish trend after breaking above 21470, as previously mentioned. It is now continuing toward the target at 21770.
Currently, price is approaching the resistance at 21775.
If it fails to break above and stabilizes below 21775, we may see a consolidation within the range of 21775–21640.
🔺 A 1H close above 21775 may trigger a continued bullish move toward 21920 and 22100.
🔻 A 1H close below 21640 could lead to a correction down to 21475.
Resistance: 21775, 21920, 22100
Support: 21640, 21510, 21370
NSDQ100 INTRADAY ahead of ADP Jobs andd PMI dataToday’s key focus is on U.S. jobs and services data, and the Fed’s tone.
Markets will react to signs of inflation, growth and the Feds speech which could indicate a shift in direction of its core policy.
Key Support and Resistance Levels
Resistance Level 1: 22040
Resistance Level 2: 22250
Resistance Level 3: 22690
Support Level 1: 22330
Support Level 2: 22010
Support Level 3: 20780
This communication is for informational purposes only and should not be viewed as any form of recommendation as to a particular course of action or as investment advice. It is not intended as an offer or solicitation for the purchase or sale of any financial instrument or as an official confirmation of any transaction. Opinions, estimates and assumptions expressed herein are made as of the date of this communication and are subject to change without notice. This communication has been prepared based upon information, including market prices, data and other information, believed to be reliable; however, Trade Nation does not warrant its completeness or accuracy. All market prices and market data contained in or attached to this communication are indicative and subject to change without notice.

Hanzo / Nas100 15 Min Path ( Tactical Break Out Zones )🔥 Nas100 – 15 Min Scalping Analysis (Bearish Setup)
Bias: Waiting For Break Out
Time Frame: 15 Min
Entry Type: Confirmed Entry After Break Out
👌Bullish After Break : 21740
Price must break liquidity with high volume to confirm the move.
👌Bearish After Break : 21675
Price must break liquidity with high volume to confirm the move.
☄️ Hanzo Protocol: Dual-Direction Entry Intel
➕ Zone Activated: Strategic Reaction from Refined Liquidity Layer
Marked volatility from a high-precision supply/demand zone. System detects potential for both long and short operations.
🩸 Momentum Signature Detected:
Displacement candle confirms directional intent — AI pattern scan active.
— If upward: Bullish momentum burst.
— If downward: Aggressive bearish rejection.

Bears still are hereWhen we were talking about the negative financial consequences of tariffs and protectionism, the markets were declining — you can check our previous forecasts, we were right.
After that, the markets started to recover from the bear market — it's unclear why, since volatility and Trump’s reckless policies persist.
The coming years, we’re all going to be spending time with the bears. "Buy the dip" and "buy and hold" strategies are, to put it mildly, not the best options this year or next.
Get ready for the next recession.

Can Tech Strength Still Drive Markets Amid Trade Tensions?Macro approach:
The Nasdaq 100 (USTEC) began Jun with strong momentum after its best monthly performance since 2023, fueled by robust tech earnings and a brief lull in tariff concerns.
- However, renewed US-China trade tensions resurfaced early in the week, briefly weighing on sentiment before a market rebound restored cautious optimism.
- Nvidia (NVDA) surged due to the continued demand for AI chips. At the same time, Tesla (TSLA) drew investor focus ahead of its 12 Jun robotaxi launch, helping maintain positive momentum in the face of geopolitical uncertainty.
Technical approach:
- USTEC is now testing the previous swing high near 218000, staying above both EMAs, a sign of ongoing bullish strength.
- A clear break above 21800 would likely open the path toward the record-high zone near 22200.
- Failure to do so may trigger a pullback toward the nearest support of around 20700.
Analysis by: Dat Tong, Senior Financial Markets Strategist at Exness

NAS100 - Potential Targets [SHORT]Dear Friends in Trading,
How I see it:
Nasdaq is currently within a key Supply Zone.
There is a little more liquidity above 21800 that could potentially be swept.
Should this previous key Supply Zone offer enough selling pressure, and or profit taking,
price can be forced to fill buy side gaps at long last.
SHORT Threshold = 20755 - 20617
Potential Gap Targets: "SHORT"
1] 20200
2] 18400
I sincerely hope my point of view offers you valued insight.
Thank you for taking the time to study my analysis.

Nasdaq Big Move (Trump Tariff Pause Effect)yesterday S&P 500 did biggest reversal move since 2008,
its bullish sign for use stock, therefor smart money expecting to buy again ,
there for we are expecting sharp move on CPI event, where smart money will buy with big order for log next 90 days

Bullish on us100, still anticipating more higher prices.21800 is most likely going to be the next HTF(daily) draw on liquidity🧲. 1h MMBM playing out well, I'd like to see price get more bullish momentum when it retraces to 1h mb + fvg.

Hanzo / Nas100 15 Min Path ( Confirmed Break Out Zones )🔥 NAS100 – 15 Min Scalping Analysis (Bearish Setup)
Bias: Waiting For Break Out
Time Frame: 15 Min
Entry Type: Confirmed Entry After Break Out
👌Bullish After Break : 21450
Price must break liquidity with high volume to confirm the move.
👌Bearish After Break : 21365
Price must break liquidity with high volume to confirm the move.
☄️ Hanzo Protocol: Dual-Direction Entry Intel
➕ Zone Activated: Strategic Reaction from Refined Liquidity Layer
Marked volatility from a high-precision supply/demand zone. System detects potential for both long and short operations.
🩸 Momentum Signature Detected:
Displacement candle confirms directional intent — AI pattern scan active.
— If upward: Bullish momentum burst.
— If downward: Aggressive bearish rejection.
💯 Market Zone: Transition Phase
Asset in premium-to-discount (or vice versa) range — valid for both reversal and continuation trades. Execute with precision.

NASDAQ: Initiated bullish wave to 22,150.Nasdaq remains heavily bullish on its 1D technical outlook (RSI = 67.266, MACD = 427.500, ADX = 25.384) and just formed a 4H MACD Bullish Cross. This validates the extension of the current Bullish Wave, second inside the short term Channel Up. We anticipate again a +5.40% rise, TP = 22,150.
## If you like our free content follow our profile to get more daily ideas. ##
## Comments and likes are greatly appreciated. ##

US100 So looking back on how i took this trade ,it was all about understanding structure as a whole from the higher timeframe, Price action is an algorythm , and it always respects high timeframes before going in lower timeframes.Theres alot you have to prioritise before taking any rades like, understanding the flow of price action from the Macro View rather than the Micro . That took me 4+ years to understand and many more things but don't be ignorant learn a few things from good trades.

NAS100
The price recently made a higher high (HH) and pulled back slightly — suggesting a possible continuation of the uptrend.
Entry Trigger:
→ "Entry after breakout of previous HH" at 21,711.84.
This means you should wait for a candle close above this level to confirm the breakout before entering a long trade.
🎯 Targets and Stop Loss
TP 1 (Take Profit 1): 21,885.22
TP 2 (Take Profit 2): 22,062.17
→ These are logical next resistance zones after the breakout.
SL (Stop Loss): 21,550.26
→ Placed just below a minor support level, giving room for volatility while managing risk.

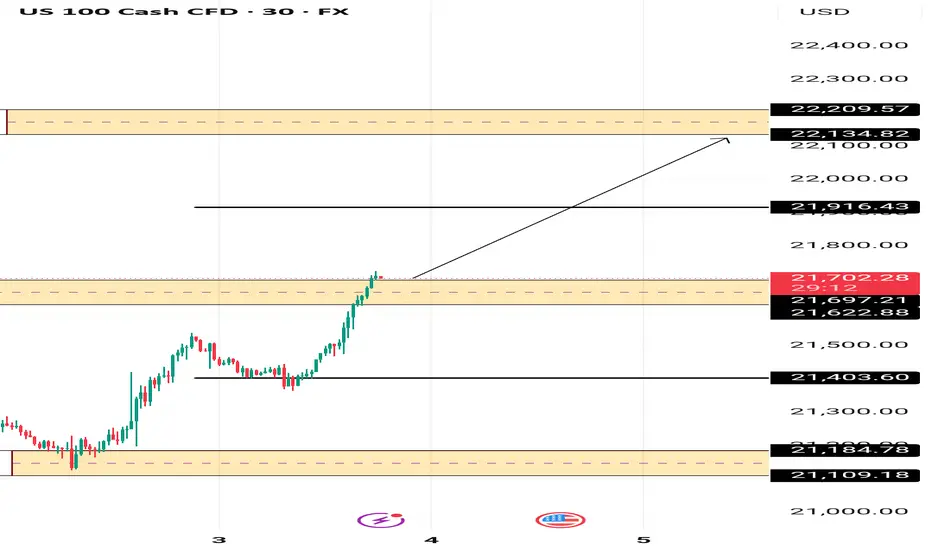
US100 BULLISH SCENARIOThe Nasdaq bullish sentimnent is gaining momentum with a good break our Pivot area between 21697 and 21622 .
A continuation of the current bull move expected if the pivot area holds with 21916 and 22134 targets .
"When Price Confirms The Vision" NAS100“Go peep my last NAS100 post 📌—I told y’all I wasn’t in the trade, but the lesson was clear. 💡
Price moved exactly how I expected, respecting my key levels and analysis to the pip.
This is why we trust the process, not just the profit. 🧠💰
Study the breakdown, learn the blueprint. The next one’s always around the corner.”
Currently Looking for 2nd Entry
#NAS100 #SmartMoney #InducementKing #MarketStructure #PriceAction #TradingView #JuicemannAnalysis**
Bless Trading!
