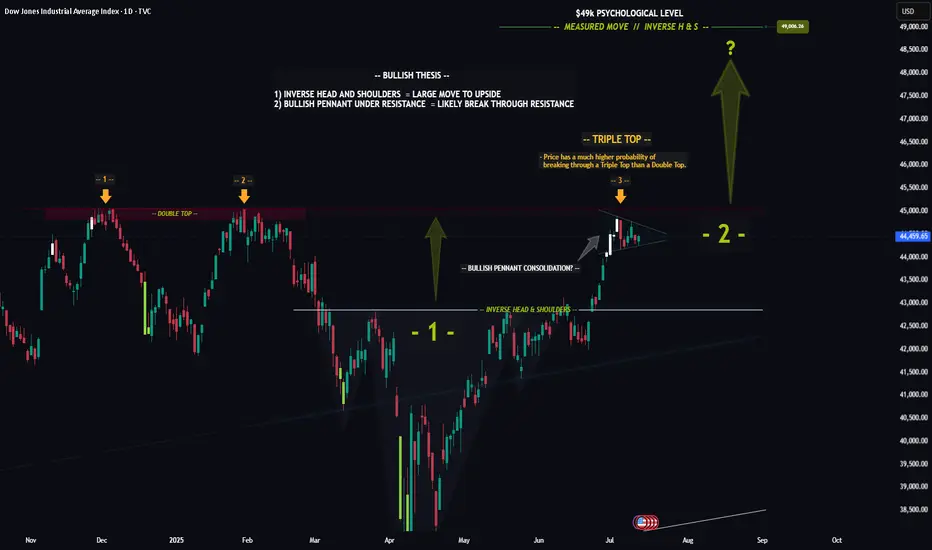
DOW (DJI) -- Preparing For The Next Big Move?Hello Traders!
The chart of the DOW is really quite incredible... Recently price formed a textbook Inverse Head & Shoulders pattern, which led to a nice nearly to the all time high. Furthermore price looks to be consolidating in a Bullish Pennant just below the all time high resistance level.
The reason the Pennant below resistance is so significant is because this signals that investors are likely preparing to drive price higher to new highs. Think about it like a fighter resting before the next big fight.
Triple Top: In addition to the pennant price has now hit this resistance level for the 3rd time. The more times price hits a level typically the weaker it gets. After the 3rd hit the chance of a breakout increases dramatically.
In Summary: The "Triple Top" in conjunction with the "Bullish Pennant" means that there is undoubtedly a very high probability that price will breakout and make new all time highs.
This post is primarily meant to be educational vs a trade idea. Its charts like this that invigorate my technical analysis side and I hope it does for you as well.
Best of luck on your trading journey!
US30 trade ideas
US30 SELLWe've seen a shift on the H4
Confirmation for a swing sell
Proper risk management is advised
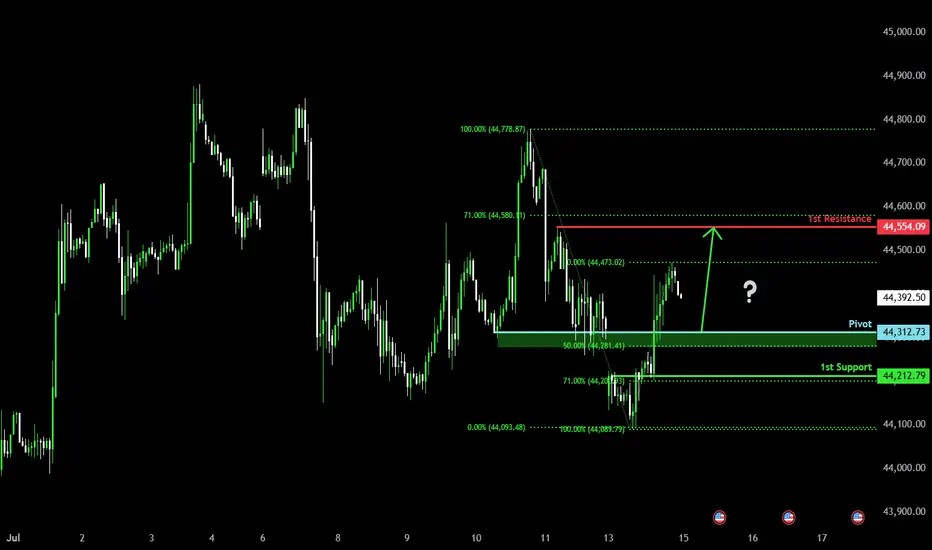
Bullish bounce off pullback resistance?Dow Jones (US30) is falling towards the pivot and could bounce to the 1st resistance.
Pivot: 44,312.73
1st Support: 44,212.79
1st Resistance: 44,554.09
Risk Warning:
Trading Forex and CFDs carries a high level of risk to your capital and you should only trade with money you can afford to lose. Trading Forex and CFDs may not be suitable for all investors, so please ensure that you fully understand the risks involved and seek independent advice if necessary.
Disclaimer:
The above opinions given constitute general market commentary, and do not constitute the opinion or advice of IC Markets or any form of personal or investment advice.
Any opinions, news, research, analyses, prices, other information, or links to third-party sites contained on this website are provided on an "as-is" basis, are intended only to be informative, is not an advice nor a recommendation, nor research, or a record of our trading prices, or an offer of, or solicitation for a transaction in any financial instrument and thus should not be treated as such. The information provided does not involve any specific investment objectives, financial situation and needs of any specific person who may receive it. Please be aware, that past performance is not a reliable indicator of future performance and/or results. Past Performance or Forward-looking scenarios based upon the reasonable beliefs of the third-party provider are not a guarantee of future performance. Actual results may differ materially from those anticipated in forward-looking or past performance statements. IC Markets makes no representation or warranty and assumes no liability as to the accuracy or completeness of the information provided, nor any loss arising from any investment based on a recommendation, forecast or any information supplied by any third-party.
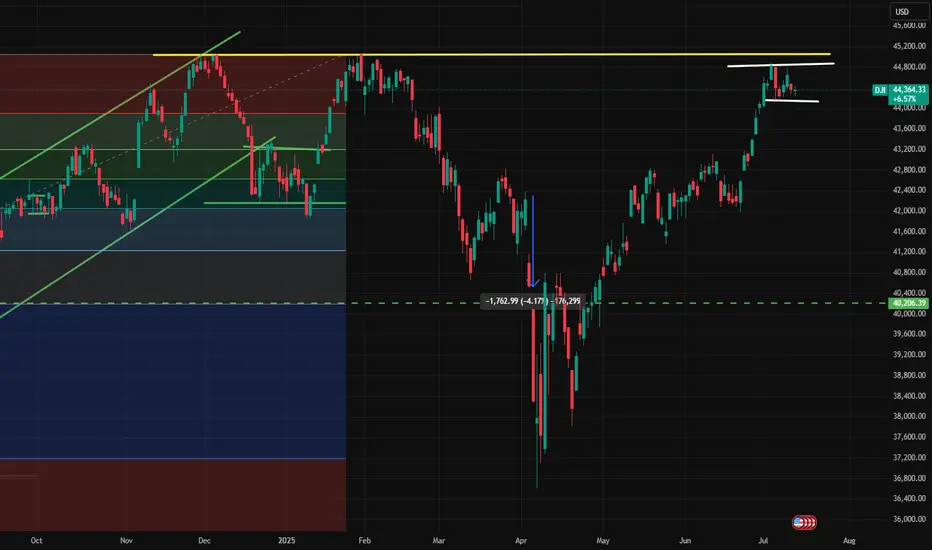
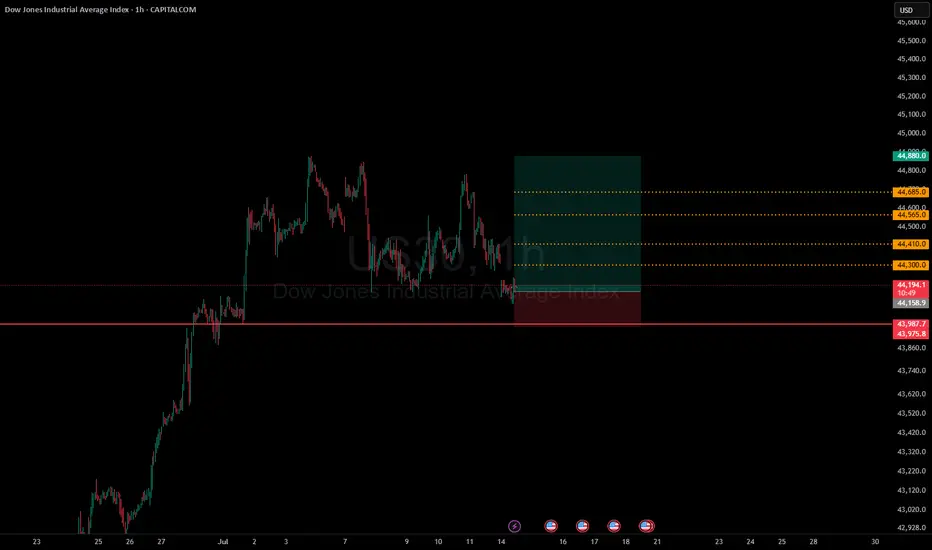
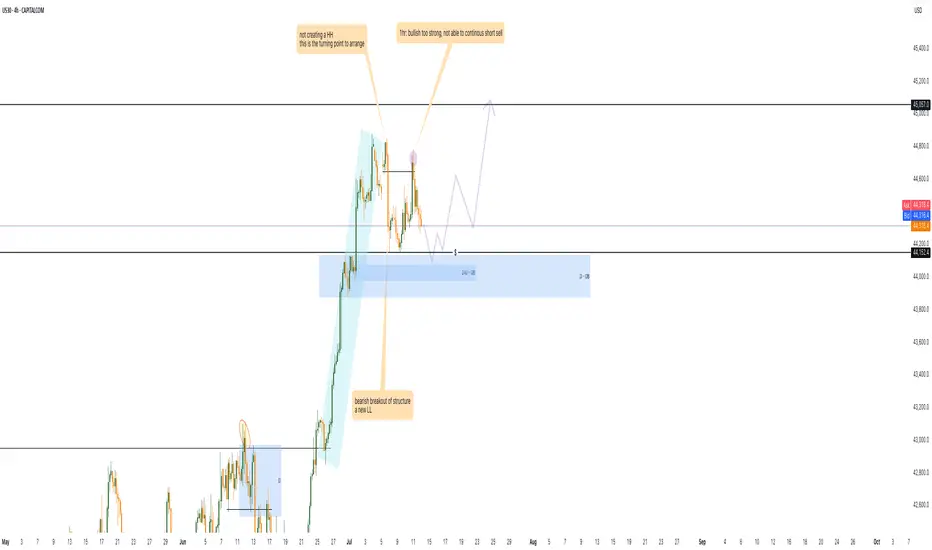
Dow Jones Technical Outlook – July 2025The Dow Jones is currently trading in a tight consolidation range just below its major resistance zone near 45,200.
After a strong bullish rally, the index is showing signs of exhaustion with lower volatility and sideways price action — forming a potential rectangle pattern. This type of structure typically signals a continuation or reversal, depending on the breakout direction.
📌 Key Levels to Watch:
Resistance: 45,200 – A breakout above this level may trigger a strong upside rally toward
Support: 44,050 – A breakdown below this can open the door for a retest of 43,200 or even 42,000.
Price is coiling — the market is waiting. The next breakout could set the tone for weeks to come.
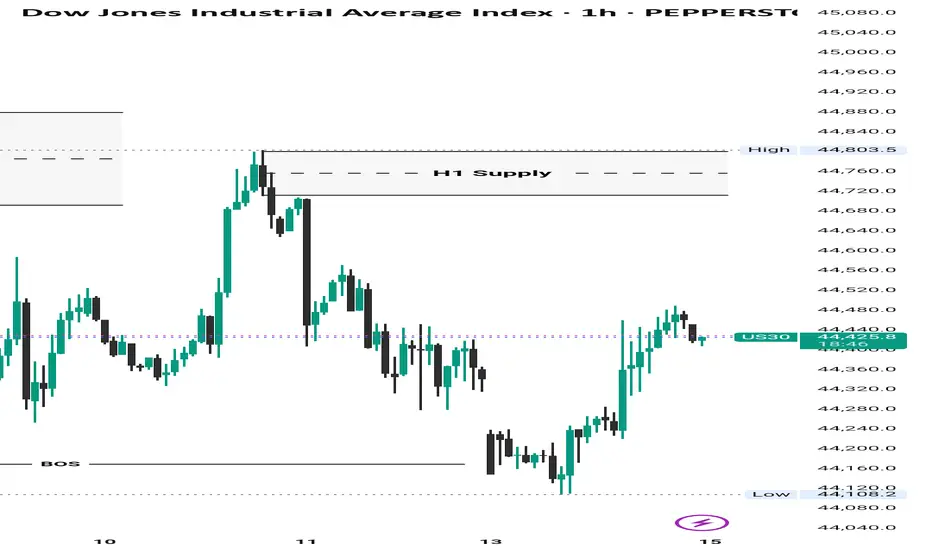
US30 Bearish Below 44490 – Watching 44180 US30 Analysis
US30 remains bearish below 44490, with downside targets at 44180 and 43960.
A 1H close below 44180 would confirm continuation toward 43630.
To turn bullish, price must break above 44490.
Pivot: 44430
Resistance: 44460, 44550, 44760
Support: 44180, 43960, 43630

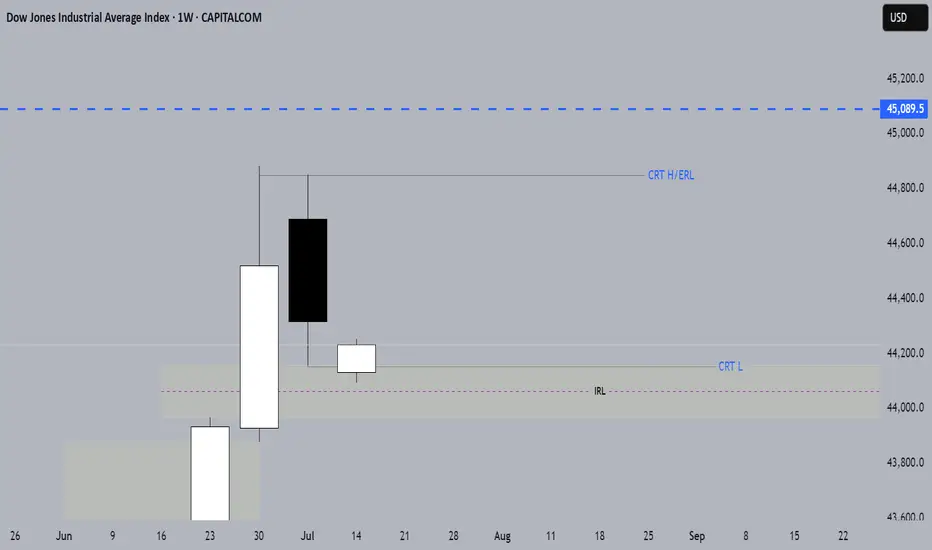
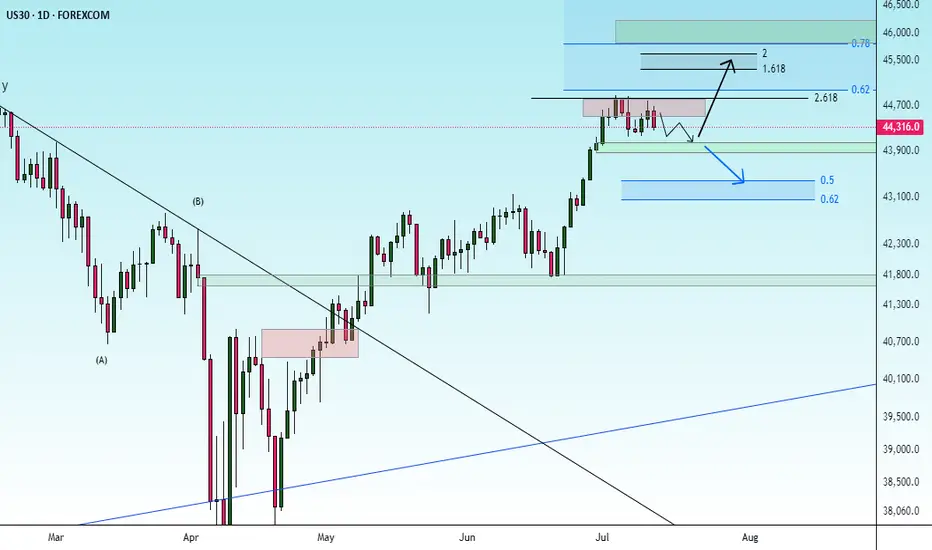
US30 BULLISH/ CRT, ERL&IRL CONFIRMATIONUS30 TO 45089.5
July is historically one of the Dow’s best-performing months.
WEEKLY CRT
IRL TO ERL
BUYTrend Line Break
Previous Day Volume
Rejection Point
Untapped Order Point
London Session
High Structure Swing

DOW JONES INDEX (US30): Classic Gap Trade
I see a gap down opening on US30 index.
As always, there is a high chance that this gap is going to be filled.
A bullish imbalance candle and a local change of character CHoCH
indicate a highly probable rise to a gap opening level.
Target - 44300
❤️Please, support my work with like, thank you!❤️
I am part of Trade Nation's Influencer program and receive a monthly fee for using their TradingView charts in my analysis.

US30 Market Recap – 07/14/2025📍 US30 Market Recap – 07/14/2025
We’ve officially broken down out of the consolidation range between 44,220–44,867 📉
The structure is now shifting bearish, with price printing a series of lower highs and lower lows, and EMAs flipping to the downside. Sellers are in control heading into the week.
📊 Current Structure:
Bearish market shift confirmed below 44,220
EMAs (20 & 50) now angled downward and acting as dynamic resistance
Trendline support from June rally is broken
Last bounce attempt from 44,260 was weak and quickly faded
🔑 Key Levels:
🔽 Support: 43,800 → 43,600 → 43,300
🔼 Resistance: 44,220 → 44,400 zone
🧭 Pivot zone: Watch 44,000 psychological level for reactions
💡 Trade Setup Ideas:
🔻 Short Setup (Trend Continuation):
Entry: Retest + rejection near 44,220 or descending EMAs
TP1: 43,800
TP2: 43,600
SL: Above 44,300
⚠️ Avoid longing unless we reclaim and hold above 44,400 with strong momentum.
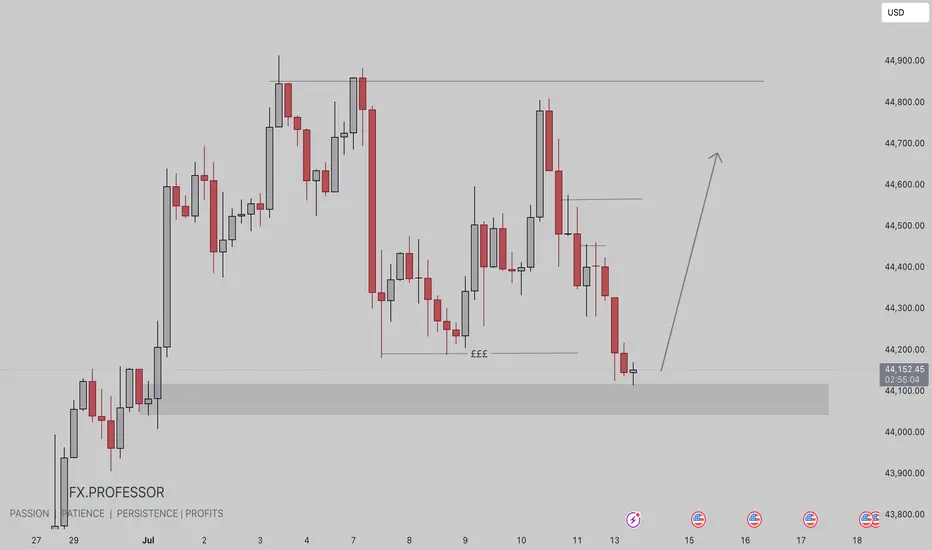
US30 BUY IDEA • Extreme Demand Zone Entry:
Price has cleanly tapped into a refined demand zone between ~44,050 to 43,994, a prime area for institutional entries. This aligns with a previous accumulation zone from late June.
• Triple Equal Lows (₤₤₤) Swept:
Clear liquidity grab beneath the equal lows, suggesting SMC-style inducement to fuel bullish orders.
• High R:R Setup in Play:
The long setup offers an expansive upside toward the 44,851 level — representing a premium retracement zone, inefficiency fill, and possible internal BOS confirmation.
14.07.25 Morning ForecastPairs on Watch -
FX:NZDCAD
FX:USDJPY
FX:EURUSD
OANDA:US30USD
A short overview of the instruments I am looking at for today, multi-timeframe analysis down to what I will be looking at for an entry. Enjoy!

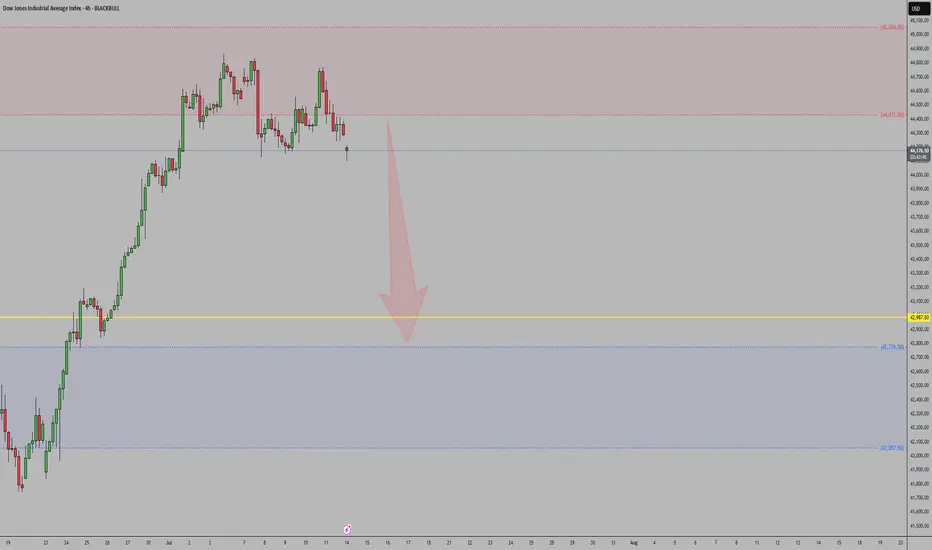
US30Net long positions are decreasing, signaling that institutional speculators are reducing exposure.
Commercials are increasing short positions, suggesting smart money expects downside in US equities.
Price rejected strongly from a weekly supply zone, failing to break previous highs.
A bearish break of structure (BOS) has occurred, with price forming a lower high and lower low pattern.
This aligns with broader macro conditions (stronger USD, rising yields).
Bias remains bearish — looking to sell pullbacks into premium zones or supply areas.
Crystal ball market Crystal ball market ..market insights are invaluable! Their team provides actionable advice and their customer service is top-notch. A trusted broker in this industry!

correctionIt is expected to fluctuate within the current support level and then continue the upward trend.
If the index breaks through the green support level, the correction to the next support level is possible.
US30US30 needs some more correction before we go bullish again.
Disclosure: We are part of Trade Nation's Influencer program and receive a monthly fee for using their TradingView charts in our analysis.

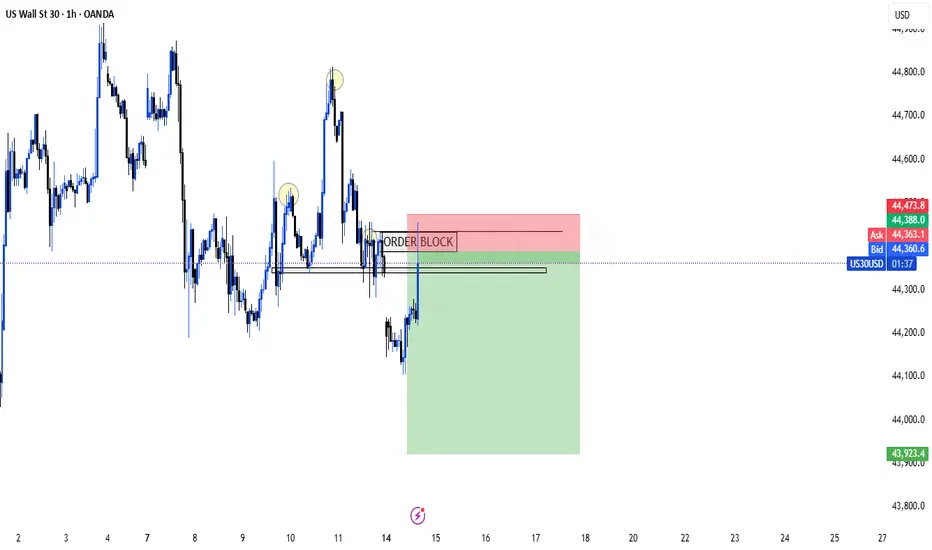
US30 prepare for the bullish 1. there is double bottom at 44152 level, i will tend to wait for the sweep meaning the price go down and hit the 4hr order block.
2. wait for 15m/ 30m TF a strong bullish momentum.
3. retest the 44152 around level or 0.618 to enter the market to long
US30 Sell continuationUS 30 appears to be running SSL. 4H levels identified. Looking for Break & retest. If support does not hold on to any level, expect the bulls to return and take over.
Dow Jones Potential DownsidesHey Traders, in the coming week we are monitoring US30 for a selling opportunity around 44,270 zone, US30 is trading in an uptrend and currently seems to be attempting to break it down, if we get dips below the trend we will be looking for a potential retrace towards further downsides.
Trade safe, Joe.
US30SIGNAL: BUY
A) SETUP: B (h1 wave5 to Correction)
B) CONFIRMATION:
1) SBT: done
2) RSI DIVERGENCE: done
3) MOMENTUM CANDLE: done
C) RR = 1:3
US30 TradeA dip into my point of interest to clear liquidity resting there will trigger our long trade scenario
US30 BUY IDEA🔍 Key Technical Highlights:
• Demand Zone Entry:
• Price tapped into a strong demand zone (gray box) around 44,280 – 44,330, signaling potential institutional buying interest.
• Liquidity Grab:
• Sell-side liquidity has been swept just below the previous lows, which aligns with a classic SMC liquidity manipulation before a bullish move.
• Projected Market Structure Shift:
• Price is forming a higher low, hinting at a potential reversal and bullish BOS (Break of Structure).
• Expecting a multi-leg bullish move, targeting 44,812 area, filling imbalance and reaching premium zones.
• Risk-Reward Outlook:
• Stop loss placed just below the demand zone.
• Take profit aligned with previous highs and inefficiency zone — a favorable R:R ratio for swing traders.
⸻
🧠 Smart Money Narrative:
1. Sweep of liquidity below demand.
2. Institutional buy orders triggered.
3. Low-risk buy opportunity with clear internal structure shift.
4. Bullish continuation toward premium pricing and unfilled imbalances.
