Mask will recovery to 14.5 USD zoneMASK in hour chart are at botton of a ascendent channel. This give good condition to go up.
MASKUSDT trade ideas

Mask Bullflag, possible breakout pending (4 hr char)Hello, Mask has dropped significantly. Now it has formed a bull flag on 4 hr chart. An increase in volume can cause a significant gain. Not a financial advice

MaskusdtperpPotential downtrend to the support, lets short this and make the 6% potential profit
Keep the leverage between 2x-5x

MASK/USDTConfirmaciones en zona de soporte y patron de tres vellas con sobre venta de stoch en MASK, esperamos aumento hasta máximo anterior

MASK Potential BREAKOUT!I think we are really close to a little breakout after the big dump we saw this week.
MY IDEA ONLY NOT A FINANCIAL ADVICE!!!
Love Yall :)

MASK-USDT long (altseason) --1hour--Hello 🧐
This is a short technical approach analysis. I am expecting price to break resistance and head for 17.6, then come back down and test 16.6 support before more up. We have formed a nice symmetrical triangle structure over the last week, this could be bullish or bearish but I am leaning towards bullish because of the support we have gained at the bottom of the structure.
⏫📈😄
There also seems to be a bullish bat harmonic pattern on hourly TF.
Invest at your own risk!!
🛑🛑🛑This is not financial advice🛑🛑🛑 Above are approximate targets based on fibs and major trend lines etc. I always recommend looking at multiple charts when making a big investment, thank you!
Always have a stop loss ✋🛑💲 set🆗
Any thoughts 💭💡, questions 🙋♀️🙋♂️❓, good 👍, bad👎, happy 😄 or sad 😥, in the comments always welcome.😄
Jazerbay

MASKUSDT - UPDATEMASK since breaking out above the descending corrective trend on the daily timeframe with a bullish impulse has now made a correction to retest the zone as new support, we can currently see on the 4hr timeframe the corrective move has been in the form of this bullish pennant formation. We can expect a little more consolidation and the range to tighten before a breakout occurs. Waiting for valid entry rules to be satisfied before we can take a possible leverage long position.

MASKUSDT - BREAKING UP!MASKUSDT is trying to break the trendline resistance and bounce from a support zone. If bulls react well then we could see a push towards 17.50 followed by 18.50. Good Luck!

MASK BULLin my experience, MASK is usually bull When bitcoin is bear and also look at this nice head and shoulders pattern in the weekly. It could drop but IMO it'll run hard

MASKUSDT - Long - Potential 32.90%MASKUSDT - Long - Potential 32.90%
Exchanges: Huobi.pro, KuCoin, Binance
Signal Type: Regular (Long)
Entry Zone:
15.971 - 16.995
Take-Profit Targets:
1) 17.677
2) 19.519
3) 22.527
Stop Targets:
1) 14.501
Entry Trigger - In a nice pullback after a triangle breakout


MASKCup and handle
targets :
1- 30 USD
2- 42 USD
A cup and handle is a technical chart pattern that resembles a cup and handle where the cup is in the shape of a "u" and the handle has a slight downward drift. A cup and handle is considered a bullish signal extending an uptrend.

MASKUSDTHello Crypto Lovers,
Mars Signals team wishes you high profits.
We are in a 4-hour time frame.
As you can see, the price has been able to break the resistance line and began moving upwards, and is fluctuating within a channel.
If it can break our resistance line, it can start moving upwards, and if it can not break the resistance line, it can start moving towards the specified support lines.
Warning: This is just a suggestion and we do not guarantee profits. We advise you analyze the chart before opening any position.
Wish you luck

maskusdtin the ichimoku cloud we can see maybe the upward movement is starting in coming day. Also, it needs to breakout the head and shoulders' neckline. all the target are mentioned in the chart.

Mask Plot.I believe these targets will be smashed, Reasons are obvious if you're following how the world is pivoting > social trends and people spending more time at home are going to be a big factor for this, People who like to flex their personal belongings and brag about status can now do it online for everyone to see all in one place, how does this benefit mask? they're making it possible for people to combine all their digital assets/achievements and showcase it to the world verified on chain ( this will be YOUR web 3 profile), If you think this is not for you and you're a humble person that's fine you can still benefit from the ones who like to flex, the market for this is huge, Mask also has great backers so long term it has some insurance.
MASK / USDT 2h - Falling wedgeThis is how I would trade MASK / USDT based on the 2h time frame and Fibonacci retracement model.
If the price breaks the upper line of the falling wedge - I recommend that you wait for a solid confirmation - then enter a long position.
Take profit ideas:
TG1 - 12.80$
TG2 - 14.17$
TG3 - 15.50$
TG4 - 17.30$
TG5 - 19.50
I keep it simple and clean!
Likes, comments, and follows are dearly appreciated.
Let me know what you think and which ones you would like for me to analyze next.
Trade safely!

mask/usdtAt shorter intervals, the long-term uptrend line is broken
And Polbeck has hit that area and is probably moving to designated points

Market structureI have 4 signs we are in for a buy.
1) the price is at a support.
2) the price just hit my 200EMA.
3) the price just hit my trend line on D1 TF.
4) the price is at oversold on the RSI.
Now we await buy signal 🙂 either with candle 🕯️ stick or trend line breakout analysis.
Time to buy also apply WSD to filter the market noise.

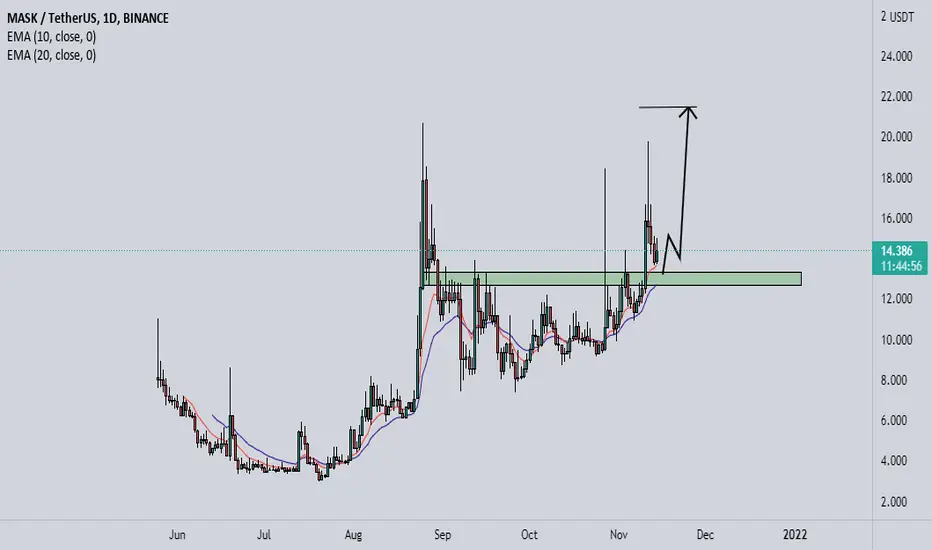
MASKUSDT UPDATE
Mask is getting ready for the next leg up, we can see price is retesting the breakout in confluence with the 618 fib, very similar PA which occurred before the previous leg up. We are waiting on 4hr timeframe for a valid entry according to the rules of this particular strategy.
Buying #MASK HereMY GEM
MASK/USDT 10x
Now : 14.06$
Target 1 : 14.5$
Target 2 : 15$
Target 3 : 15.2$
Enjoys !!

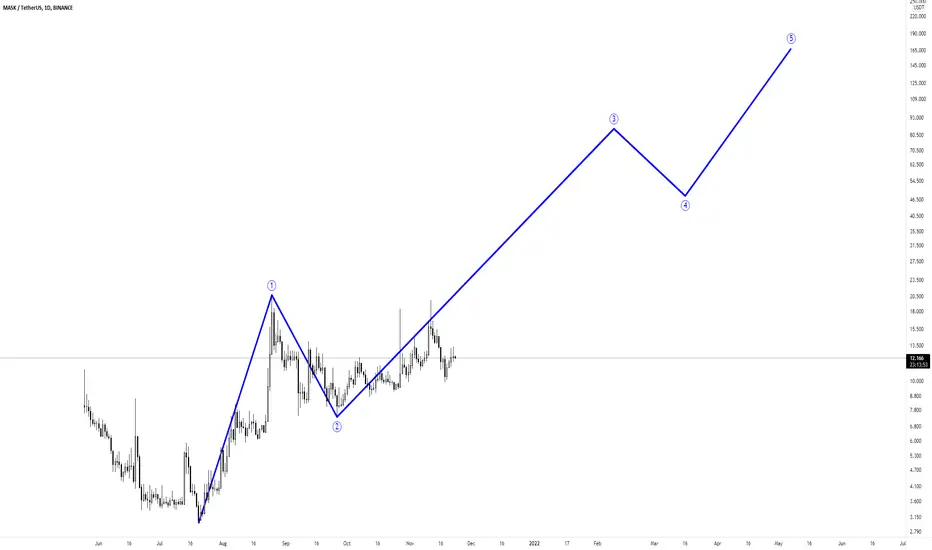
Mask will have a 400% increase
It moves perfectly
It didn't rise much after going online
The main force will definitely not let it miss this wave of bull market
Buy it and hold

#MASK is going to 18$#MASKUSDT ( SPOT )
~ Forming Ascending Triangle Pattern in 1D Timeframe 📈
~ RSI Still Printing Bullish Divergence 📈
~ Buying Some Around here 🚀
Current price $13.84

