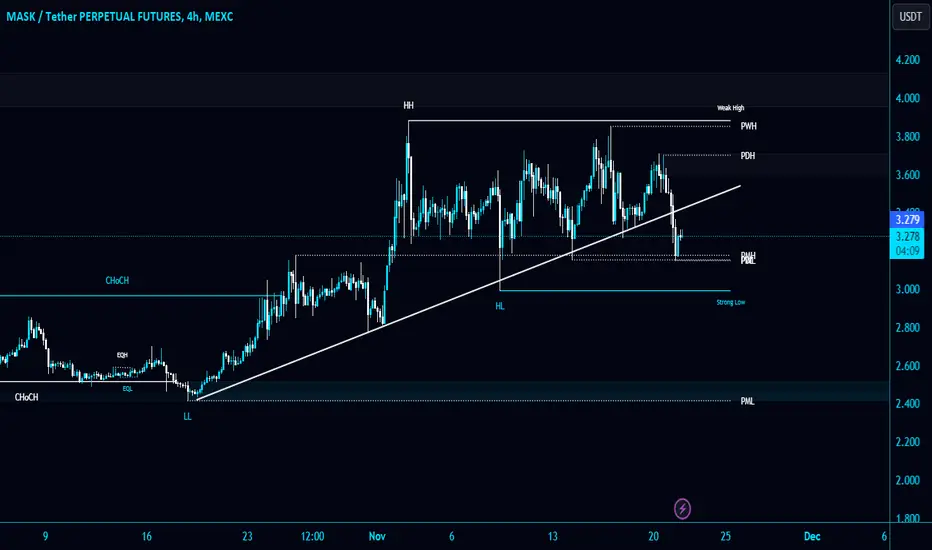
#MASK/USDT breaks the Diagonal Trendline in 4-Hour TF!#MASK/USDT breaks the Diagonal Trendline in 4-Hour TF!
$MASK is so far holding the PMH $3.175 as a strong support, which is a good sign. Wait for Diagonal Trendline reclaim to long it.
If #MASKUSDT retest and reject from the Trendline we can short it.
MASKUSDT trade ideas

MASK/USDT Anticipating a Bullish Break? 👀 🚀Mask Today analysis
💎 Paradisers, let's turn our focus to #MASKUSDT, which is currently demonstrating a compelling pattern. It's making strides to break through a supply level, suggesting a strong possibility of a bullish move following this breakout.
💎 $MASK has consistently shown a pattern of following a descending channel, breaking above it to initiate an upward trajectory. Presently, it is trading within a range and is actively attempting to surpass the supply level of 3.871. Once it successfully breaks this level, there's a substantial chance for a bullish movement. With continued upward momentum, #Mask is setting its sights on reaching higher supply levels, potentially up to $4.881.
💎 For the sagacious Paradisers, timing is key in making the most of this situation. Identifying optimal entry points during this anticipated rise is essential, as well as being cautious not to enter at the peak of the market. Moreover, be prepared for a potential bullish rebound from the support level of $3.02. Nonetheless, a drop below this support level could indicate challenges in maintaining a bullish trend.
💎 In this fluid and evolving market environment, strategic thinking and effective decision-making are crucial. Developing a comprehensive trading strategy, which includes sound money management and a thorough understanding of support and resistance levels, is vital to achieving successful trading results. 🌴💰

MASKUSDT - Buy Opportunity!MASKUSDT (1D Chart) Technical analysis
MASKUSDT (1D Chart) Currently trading at $3
Buy level: Above $2.93
Stop loss: Below $2.42
TP1: $3.4
TP2: $4
TP3: $4.7
TP4: $6
Max Leverage 2x
Always keep Stop loss
Follow Our Tradingview Account for More Technical Analysis Updates, | Like, Share and Comment Your thoughts

MASK towards 5$ or higher 🙂👍Personal idea: Mask shows upside momentums and based on the it's trend, I predicted the price of 5$ or a bit higher can be the target of bulls in this period. Good 🙂 luck 👍

🚨 Trade Alert: MASK/USDT (3-5x)🚨 New Trade Alert 🚨
✅ MASK/USDT (3-5x)
📉 LONG Entry Zone: 3.23 - 3.47
⛔️ SL: 3.093
🔒 Breakeven Move: When it moves close to TP2
🎯 Take Profit:
Short Term: 3.51 - 3.55 - 3.60 - 3.70 - 3.80
Mid Term: 3.90 - 4.05 - 4.20 - 4.40 - 4.60 - 4.82
📝 Ensure you set entry orders to balance the trade's entry and aim to secure 30% of profits within the first two targets. Once profits are gained, adjust the stop orders to match the entry points or break-even levels.
⚠️ Disclaimer: Historical earnings cannot assure future outcomes. Is there a potential for risk? Certainly. The entire financial market is susceptible to uncertainties; any underlying factor or abrupt shift in market sentiment could overturn the current market trends and lead to losses. Refrain from undertaking undue risks that might jeopardize your financial stability. You are under no obligation to engage in this trade; kindly avoid the trade if you disagree with the trade analysis.
GIS TRADING®

Mask currency signal analysisAfter colliding with the support of 3.25 we now see the signs of re -climbing
A beautiful RSI positive divergence of this currency is observed
The volume of good liquidity has also collected
I expect to be up to the top
Be sure to put the loss limit if you make the deficit, but if you make it, be sure to put it down 2.94
Each 2 % climbing must make sure you make a profit

MASKUSDTTRADE ALERT! $MASK
Ticker: MASK/USDT
Entry: $3.57-3.68
Take Profit: $4.48
Stop Loss: $3.169 (Daily Close Below this)
Risk to Reward: 1:2
Technical: A robust support is evident around the $3.681 mark. Once the price surpasses this level, there is a potential for a subsequent move to test the range between $4 and $4.48.

MASK is pumping slowly MASK exactly hitted at our suggested buying level, we can wait our TP1 and TP2 level for handsome profit, only for SPOT, not for leverage trading

MASKUSDTMASKUSDT was trading in symmetrical triangle pattern. The price was reacting well the support and resistance of triangle.
Currently the price has given the breakout of triangle and now retesting the broken level where it is also forming a local support zone and seems like the price may go for another leg higher.
If the breakout sustain to upside the optimum target could be 3.8 followed by 4.5
What you guys think of this idea?

MASK going to 7$Hellow Traders, i have marked important levels of MASK, people can buy MASK in spot, hold untill it reach at 7$ and enjoy awesome profit with me, i am personally holding it in spot till TP3, you analysis yourself before investing in it

MASK Tether IdeaBINANCE:MASKUSDT COINBASE:MASKUSD
⚠️ Disclaimer: The following insights reflect my personal perspective on the market, relying on publicly available information and historical data. While some opinions stem from my actual trades, others do not. I am not a financial advisor, and I bear no responsibility for your trading choices.
✅ Feel free to reach me out with any questions or recommendations. I am more than willing to assess and analyze any currency pair or index that piques your interest.

#MASKUSDT #LQR #TOBTC #LaqiraProtocolAfter a strong breakout of the $3 Level .you can look for reasons to enter certain areas after confirming your own strategy. This analysis is a personal view and is not an offer to buy or sell.


MASKUSDT Room for MovementBINANCE:MASKUSDT is showing promising price action with a significant breakout from the 2.513 level. Currently trading around 3.500, it appears poised for further upward movement.
Key Price Levels to Watch:
Support — 2.543
Resistance — 4.000
Target 1 — 4.620
Target 2 — 5.000
Target 3 — 5.500
The Fibonacci levels suggest potential price targets, with levels at 4.000, 4.620, 5.000, and 5.500. Keep a close eye on these levels as they can provide essential guidance for your trading decisions.
Remember to perform thorough analysis and manage your risk accordingly, so always trade with caution and consider setting stop-loss orders to protect your investments.
Stay tuned for updates!

#MaskIn the 4-hour period, it is suffering in the golden zone, which is ready to grow to the next range. The bullish guard is entered for the trigger and after the failure of the swing, he entered the buy trade

SasanSeifi 💁♂Price Growth Expectations After Daily PullbackIn the daily time frame, the expectation we can have is that, after completing the pullback process, the price will likely continue to grow as it moves towards the supply zone.
🔵Remember, always conduct your own analysis and consider other factors before
making any trading decisions. Good luck!"✌️
❎ (DYOR)...⚠️⚜️
Sure, if you have any more questions or need further clarification, feel free to ask. I'm here to help!
if you found my analysis helpful, I would appreciate it if you could show your support by liking and commenting. Thank you!🙌✌

MASK/USDT Break the key level area. Continue the Upward Movement💎 MASK has indeed captured the market's attention with its recent breakout above a key supply level, signaling the potential for further upward momentum. At present, MASK may enter a retesting phase at the demand zone, previously a supply area, around $3.49.
💎 Should MASK demonstrate a strong bounce off this demand level, it is likely to initiate a significant upward trajectory, with the price probability advancing toward our target supply zone and into overbought territory.
💎 Conversely, a concerning scenario could unfold if MASK revisits the demand zone and fails to exhibit a bullish rejection or a bounce. Such a failure to uphold the demand level could lead to a breakdown, suggesting that the breakout was deceptive and that downward momentum may ensue, driving MASK towards the next lower demand area.
💎 The $3.02 level stands as a critical juncture for MASK; a bounce here is essential for sustaining the uptrend and regaining the $3.49 level. However, if MASK also capitulates the $3.02 support, it could signal a bearish shift in momentum, increasing the likelihood of a reversion to the strong support area.

MASTUSDT - FutureI'm Long MASK
This trading plan incorporates mechanical strategies along with smart money concepts.
Kindly note that engaging in FX, stock, crypto investments, and other financial instruments entails inherent risks. We strongly recommend seeking advice from a financial advisor or conducting extensive research before finalizing any investment choices.

MASK looks interesting !on weekly timeframe if we flip 3.52 and hold the price level. A nice pump will happen
if you want to hold u can start buying or wait for pullbacks in a shorter timeframe.
note:
Always take profit
Not an expert just sharing my ideas
BINANCE:MASKUSDT

#MASK/USDT breaks the major $2.945 resistance zone in Daily TF!#MASK/USDT breaks the major $2.945 resistance zone in Daily TF!
$MASK is holding it as a support. I am expecting some bullish momentum. #MASKUSDT needs to clear PDH $3.095 resistance level. Looking good for Long.
Breakdown below the support is bearish.


Eyes on the Prize: MASKUSDT 100% Profit Zone⚪In the realm of MASKUSDT, the recent developments have sparked significant excitement. An unmistakable breakout from the descending channel has caught our attention. More intriguingly, preceding this bullish move, the price experienced a substantial bounce off the 427.2% Fibonacci support level. This critical Fibonacci zone could very well signify the bottom for MASK.
⚪With the shackles of the descending channel shattered, we're now eagerly anticipating a substantial rally, set to kick off either this week or the next. The upside target within our sights is the $5.5 supply zone, a level that promises nearly 100% growth from the current price.
⚪As the charts align with potential gains, MASKUSDT holds the promise of an impressive 100% surge. Stay tuned and keep an eye on the evolving market dynamics for the best entry points as this journey unfolds.
P.S. We have a trade setup already shared in our channel!
