MASK long-term plan
MASK is one of potential cryptos because of its fundamental (being backed by Binance, the world’s leading cryptocurrency exchange). It will have a lot of room to grow because of the low market cap of only $230 million (at today's price).
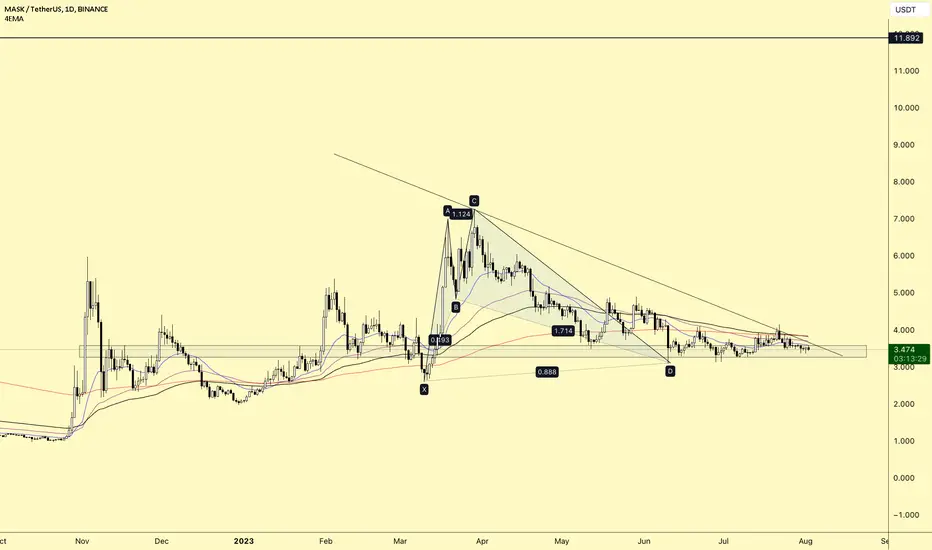
My long-term plan is presented in chart. By this, I suppose that MASK is forming an accumulation phase following Wyckoff method and we'll have opportunities to buy MASK much cheaper than its current price.
One important point is that the SC (event) would be lower than the referenced one. So I'll be ready for a second buy if prices go to $1 area (unlikely but everything is possible).
------------Information on MASK ------------------
Mask Network is a browser extension that bridges the gap between Web2 (the internet as we know it) and Web3. In other words, it enables people to access Web3 within existing mainstream platforms such as Facebook. The slogan of Mask is: your gateway to the new open internet.
Think of Mask (MASK) as a layer that adds privacy and functionalities to your social media accounts, allowing you to engage with crypto from your social media accounts. Mask connects Web2 giants such as Twitter, Facebook, and Instagram to blockchains like Ethereum, BSC, and Polygon."
MASKUSDT trade ideas

$MASK$MASK/USDT
On the Daily timeframe level, the price action of $MASK Formed out Descending Triangle pattern as well as a Bullish Harmonic Shark pattern level where the price action is consolidating in a compression level on the Horizontal Support level
We can expect the bounce back level after the breakout of the MSB level. However, the price should close above the Horizontal Support level
Overview of Cryptocurrency Volatility - 1D, November, 2022.Analysis of the volatility index in November. Time interval - 1 day.
Currency - USDT or equivalent to BUSD .
The selection is carried out according to the lists of cryptocurrencies that are represented on the spot and futures markets, with a total of more than a hundred coins.
Top 15 Coins (1 day):
1. MASK /usdt - 361.63% (High&Low: 696.13%)
2. BAND /usdt - 337.16% (High&Low: 715.42%)
3. LEVER /busd - 279.01% (High&Low: 624.26%)
4. PHB /busd - 265.87% (High&Low: 816.13%)
5. SFP /usdt - 260% (High&Low: 543.59%)
6. DYDX /usdt - 228.3% (High&Low: 473.58%)
7. SOL /usdt - 224.96% (High&Low: 403.6%)
8. GTC /usdt - 221.38% (High&Low: 481.87%)
9. CHZ /usdt - 213.19% (High&Low: 415.79%)
10. CELO /usdt - 205.89% (High&Low: 380.34%)
11. C98 /usdt - 203.71% (High&Low: 405.97%)
12. REN /usdt - 203.28% (High&Low: 452.57%)
13. AMB /busd - 202.06% (High&Low: 553.96%)
14. APE /usdt - 201.33% (High&Low: 380.98%)
15. CRV /usdt - 201.2% (High&Low: 396.61%)
The coin showed the worst result: CTK /usdt - 69.79% (High&Low: 170.42%).
Full list of analyzed coins: www.tradingview.com
Analysis information for all coins: docs.google.com
Thanks for your attention!

Overview of Cryptocurrency Volatility - 1M, November, 2022.Analysis of the volatility index in November. Time interval - 1 month.
Currency - USDT or equivalent to BUSD .
The selection is carried out according to the lists of cryptocurrencies that are represented on the spot and futures markets, with a total of more than a hundred coins.
Top 15 Coins (November):
1. MASK /usdt - 73,79% (High&Low: 168,02%)
2. BAND /usdt - 65,23% (High&Low: 218,19%)
3. SOL /usdt - 56,52% (High&Low: 85,51%)
4. NEAR /usdt - 44,51% (High&Low: 64,77%)
5. LTC /usdt - 43,87% (High&Low: 65,54%)
6. REEF /usdt - 41,64% (High&Low: 85,66%)
7. APT /usdt - 39,85% (High&Low: 61,5%)
8. HNT /busd - 39,5% (High&Low: 61,75%)
9. KAVA /usdt - 39,08% (High&Low: 50%)
10. MANA /usdt - 38,64% (High&Low: 57,78%)
11. GALA /usdt - 38,23% (High&Low: 48,02%)
12. ANC /busd - 35% (High&Low: 57,89%)
13. LUNA /usdt - 33,8% (High&Low: 59,45%)
14. FLOW /usdt - 32,42% (High&Low: 59,34%)
15. SAND /usdt - 32,17% (High&Low: 53,61%)
The coin showed the worst result: BCH /usdt - 1.3% (High&Low: 33.91%).
Full list of analyzed coins: www.tradingview.com
Analysis information for all coins: docs.google.com
Thanks for your attention!

MASK potential profitI'm a trader and this is my latest trade and I'm learning to share my experience
Behavioral reason
@the weather is nice today
@earn experience
I'm not a teacher, I'm a trader, make a profit by trading, hope this trade goes well

#MASKUSDT #LQR #TOBTC #LaqiraProtocol● The price is in trading range
•We are the seller in the highest price range
• And we bought it at the lowest price
• If break the range and confirmation, we expect the price to move as long as the range
• Numbers outside the range that are specified in the chart
• They are obtained from the intersection of fibo tubes and static surfaces
● This is not a personal analysis and a buy or sell offer

mask - to the men)False break of trend support
On the weekly timeframe sideways at support. marked by the green bar at 3.50 dollars.
Monthly candlestick looks shorts. in 3 days a new month will open and it will show whether it will fall or rise.
on the hourly timeframe a potential breakdown of the slope.

Mask price will soon make a strong moveThe MASKUSDT price has been consolidating quite well lately in preparation for a possible strong price movement.
The critical level below is $3.30. Fixing the MASK price below this level will open the way for a drop to at least the $2.35-2.60 range.
A strong liquidity zone of range $4,00-6.30 hangs above the current price of the Mask Network token.
Over the past 9 months, buyers have made at least three attempts to gain a foothold above this zone, but have failed.
So, if buyers try to move price up again, the path will not be easy. They will face strong resistance around $4, $4.90-5.00, and $6.30.
However, if MASKUSDT manages to gain a foothold above $6.30, it will open up the following medium-term targets: $9.80-10.00 and $13.50
_____________________
Did you like our analysis? Leave a comment, like, and follow to get more

Maskusdt Update Maskusdt
I am expecting price to breakdown from this channel after this uptrend as i mentioned
Let's see, for now we have to wait for confirmation no need to take unnecessary risk
Note : This is jist an early prediction, do your own research before taking any decision

MASK/USDT - Mask Network: BBand_Breakout◳◱ A Bollinger Band breakout has been identified on the $MASK / CRYPTOCAP:USDT chart, as the price has breached the upper Bollinger Band. This occurrence suggests the emergence of a potential bullish trend. Noteworthy resistance levels can be observed at 3.917 | 4.241 | 4.888, while significant support zones are located at 3.27 | 2.947 | 2.3. It is advisable to contemplate initiating a buy position within the present price range of 3.828 with the objective of attaining higher price levels.
◰◲ General info :
▣ Name: Mask Network
▣ Rank: 108
▣ Exchanges: Binance, Kucoin, Bybit, Huobipro, Gateio, Mexc
▣ Category/Sector: Services - Data Management
▣ Overview: None
◰◲ Technical Metrics :
▣ Mrkt Price: 3.828 ₮
▣ 24HVol: 17,949,148.173 ₮
▣ 24H Chng: 0.552%
▣ 7-Days Chng: 6.04%
▣ 1-Month Chng: -3.22%
▣ 3-Months Chng: -18.17%
◲◰ Pivot Points - Levels :
◥ Resistance: 3.917 | 4.241 | 4.888
◢ Support: 3.27 | 2.947 | 2.3
◱◳ Indicators recommendation :
▣ Oscillators: NEUTRAL
▣ Moving Averages: STRONG_BUY
◰◲ Technical Indicators Summary : BUY
◲◰ Sharpe Ratios :
▣ Last 30D: 0.33
▣ Last 90D: -0.43
▣ Last 1-Y: 1.27
▣ Last 3-Y: 0.69
◲◰ Volatility :
▣ Last 30D: 0.66
▣ Last 90D: 0.88
▣ Last 1-Y: 1.65
▣ Last 3-Y: 31.84
◳◰ Market Sentiment Index :
▣ News sentiment score is N/A
▣ Twitter sentiment score is 0.48 - Bearish
▣ Reddit sentiment score is 0.74 - Bullish
▣ In-depth MASKUSDT technical analysis on Tradingview TA page
▣ What do you think of this analysis? Share your insights and let's discuss in the comments below. Your like, follow and support would be greatly appreciated!
◲ Disclaimer
Please note that the information and publications provided are for informational purposes only and should not be construed as financial, investment, trading, or any other type of advice or recommendation. We encourage you to conduct your own research and consult with a qualified professional before making any financial decisions. The use of the information provided is solely at your own risk.
▣ Welcome to the home of charting big: TradingView
Benefit from a ton of financial analysis features, instruments and data. Have a look around, and if you do choose to go with an upgraded plan, you'll get up to $30.
Discover it here - affiliate link -

MUSK S&R in mid-short term>>>>>>>>>I Have Tried My Best to Bring the best Possible outcome in this Chart.
MUSK must close above 3.9-4.0USDT and stablize for 2 day's at least till bull's take they's move..
But we'll still must wait for shown more sign's at next .
It's Not a financial advise.
PLZ DYOR
With hopping success>>>>>


MASKUSDT is creating a cup and handleMASKUSDT is currently exhibiting a fascinating technical pattern known as the "cup and handle," which can be an indication of a potential bullish continuation in the cryptocurrency market.
Cup Formation: The first phase of the pattern is the "cup," which has formed after a notable uptrend. The cup is characterized by a smooth, rounded U-shape on the price chart, representing a temporary retracement or consolidation. During this phase, traders witnessed a healthy correction in the price, allowing the asset to catch its breath before potentially resuming its upward journey. The depth of the cup may vary, and the pattern typically spans several weeks or months.
Handle Formation: Following the completion of the cup, we are observing the "handle" phase. The handle is a smaller pullback that occurs after the cup's formation. It takes the shape of a short-term, downward-sloping structure. The handle should ideally not retrace more than one-third of the cup's depth. This relatively shallow and lower volume phase indicates a consolidation period with potential accumulation by market participants.
Breakout: The most exciting part of the cup and handle pattern is the potential breakout. Currently, MASKUSDT is testing the neckline, which represents the highest point of the handle. A breakout above this neckline is a critical bullish signal. When the price successfully breaks out above the neckline, it confirms the continuation of the previous uptrend and triggers buying interest among traders.
According to Plancton's Rules, a new long position may be considered if the price convincingly breaks out above the neckline of the cup and handle pattern. The breakout signals renewed strength in the asset, indicating the potential for further upside movement
–––––
Follow the Shrimp 🦐
Keep in mind.
🟣 Purple structure -> Monthly structure.
🔴 Red structure -> Weekly structure.
🔵 Blue structure -> Daily structure.
🟡 Yellow structure -> 4h structure.
⚫️ Black structure -> <= 1h structure.
Follow the Shrimp 🦐

MASKUSDTHello, I posted a signal (pinned at the bottom of the post) regarding this position. Please, if anyone has opened it, let's discuss it here. Market analysis indicates a bearish trend, and we might potentially experience a slight decline. Thank you.

Mask long idea hello Traders, here is the full analysis for this pair, let me know in the comment section below if you have any questions, the entry will be taken only if all rules of the strategies will be satisfied. I suggest you keep this pair on your watchlist and see if the rules of your strategy are satisfied. Please also refer to the Important Risk Notice linked below.

MASKUSDT📊 #MASKUSDT
⏱ TIME: 1D
📝It is reaching very important areas for spot purchases, and you can make purchases in a gradual and managed manner. It has also been checked for fundamental analysis and is a sustainable and strong project for the future.
📍The initial buying limit: 3.660 $
📌TP1: 4.74 $
📌TP2: 5.84 $
📌TP3: 7.19 $
❌SL: 3.04 $

MASK – Break out of Descending Channel• MASK is trading inside a Descending Channel for 110 days.
• Currently, it looks as if MASK is breaking out of the channel to the upside.
• Confirmation: break above 3.92 USDT and hold it as support.
• Target: 5.88
Trade Idea:
• Entry: 3.92
• SL: 3.54 (tentative, SL below previous low)
• TP: 4.94, 5.88.
• Target: 5.88 (Could go a lot higher)
• R: R: 1:4.76
NFA.
What do you think? Please share in the comments.
Best Wishes

MASK final target 912h time frame
-
MASK retesting the downtrend and creating a 1h triangle structure
Here~3.1 is good entry zone to get great RRR
TP:
1) 5.4
2) 6.5~7.2
3) 8.9~9.8
SL: 3

#LQR #TOBTC #MASKThes Fib Level are key For Mask
i expect that mask reach these green Price lable for next move so add this to you'r watchlist and in time... Do what you have to


Seems Like Is Ready For Massive Bullish Impulse Seems Like Ready For Massive bullish Impulse Falling Wedge breakout Has already Confirmed Retesting In Process Incase Of Successful Retest expecting Move towards 7$

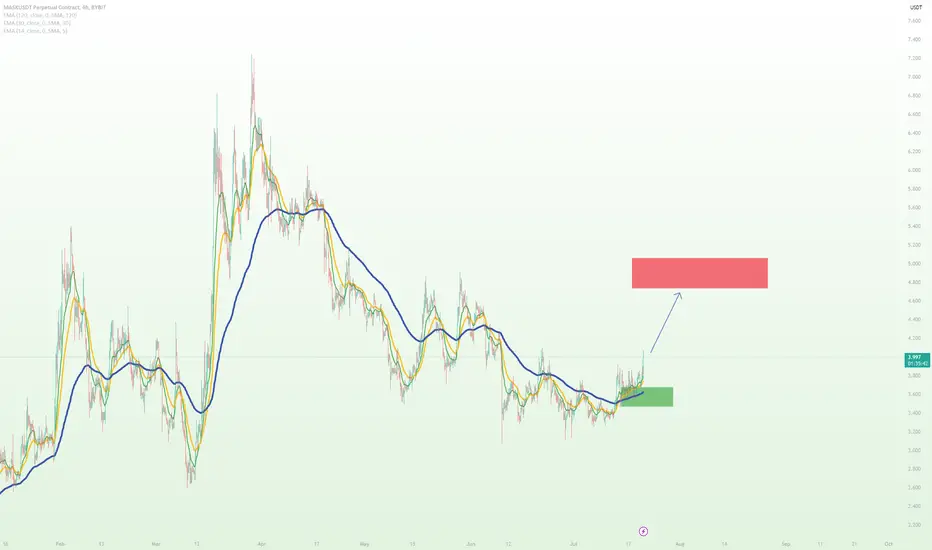
MASKUSDT → Tandem signal: resistance breakout and SMA crossing BINANCE:MASKUSDT is forming a correction in the format of a descending wedge. A rather strong consolidation is forming at the base of the uptrend under the resistance of the wedge. What to expect from the price?
The coin breaks through the formed descending resistance and begins to form a bullish impulse.
Since the bullish signal is formed at the base of the trend, the price demonstrates a rather weighty potential of 70-120%
We have a tandem signal: moving averages crossover + wedge resistance breakout.
Altcoins have recently improved dynamics and are starting to show good results, which suggests that the cryptocurrency market may come to life in the medium term.
Support levels: 3,335, trend support, previously broken wedge boundary
Resistance levels: 3,650
I expect a retest of the 3.650 level followed by a breakout. The buy signal is quite strong and there is a high probability that the coin will show bullish dynamics and rise to 4.840 or 6.00.
Regards, R. Linda!
