US OILUS OIL is reaching towards important zone which can give us a good move to the upside after it sweeps OLD LOW
WTIN2025 trade ideas

Crude oil------sell near 70.00, target 66.70-63.00Crude oil market analysis:
Recently, crude oil has been rising, and buying is slowly climbing, but the amplitude is not particularly large. The daily line has not formed a large buying pattern. It is currently a technical repair market after falling too much. Today's idea is to sell on the rebound. Pay attention to the suppression near 70.00. If this position is broken, it may change the short-term trend and buying may rise.
Fundamental analysis:
Last week, Trump increased tariffs on Canada and is about to increase tariffs on Brazil. There is no sign of stopping the tariff war. It is long-term bullish for gold. The situation in the Middle East has not completely stopped, and it is also long-term suppression of the US dollar to support gold.
Operation suggestions:
Crude oil------sell near 70.00, target 66.70-63.00

Crude Oil Trade Idea: Intraday mechanicsNYMEX:CL1! NYMEX:MCL1!
Bigger Picture:
Traders should note that news headlines do not always drive the price action. More often, news outlets look for narrative to align with the price action.
Previously, it was about the supply glut and worsening demand due to an uncertain outlook. Now the latest news flow is about Aramco OSP rising, OPEC+ adding another 548K bpd in August — higher than anticipated 411K — of the wounding of involuntary cuts. News outlets now view this as signs of demand growth and low inventories.
What has the market done?
Market has consolidated, building acceptance around microComposite Volume Point of Control at 65.50 (mcVPOC). Market then broke out of this balance.
What is it trying to do?
Market is building value higher; 2-day mcVPOC is at 68.29.
How good of a job is it doing?
Market is holding support and has tested resistance multiple times. It has also held support.
What is more likely to happen from here?
Further movement higher as long as it holds above support and yearly open confluence in the short term.
Key Levels:
• Resistance zone: 68.95 - 68.85
• pHi: 68.87
• 2-day VPOC: 68.29
• pSettlement: 68.38
• yOpen: 67.65
• Support zone: 67.70 - 67.50
• pLow: 67.89
Primary Scenario:
Crude oil pit session begins with open auction in yesterday’s range. Prices move lower to test prior day's low, 2-day balance support in confluence with yearly open. Prices push back higher towards yesterday's settlement and 2-day Volume Point of Control (VPOC) at 68.33.
Secondary Scenario:
Crude oil pit session begins with open auction in yesterday’s range. Market consolidates and chops around pSettlement and 2-day VPOC. Market takes out overnight high, fails to go further higher, and reverts lower. Settles below overnight low, however staying above prior low to continue one-time framing higher for the regular trading hours (RTH).

WTI Crude Oil Reverses Lower Near $70 ResistanceA bearish engulfing candle has formed on the daily WTI crude oil chart, with its high perfectly respecting the 38.2% Fibonacci retracement just beneath the $70 handle. Given that the bounce from the June low has been relatively weak compared to the sharp decline from $78, I’m now on alert for a potential break beneath the $64 support level.
That said, the 200-day SMA and EMA currently sit between $65.21 and $65.31, which could offer near-term support. Should oil prices attempt to grind higher within the 1-hour bullish channel, bears may look to fade rallies into the weekly pivot (67.59) or the $68.00 handle, positioning for a potential rollover. A clean break below the 200-day averages would shift focus firmly back to $64, near the June low.
Matt Simpson, Market Analyst at City Index and Forex.com

WTI Crude - Turning Bullish? Published as a supplementary analysis for BRENT CRUDE and LIOC, with further coverage to follow.
* WTI has successfully reclaimed its 4-year support line, which was breached in April 2025.
* The Monthly Momentum Indicator reveals a robust bullish breakout, signaling renewed strength.
* As long as WTI maintains its 4-year support line, caution is warranted when considering bearish positions.
Crude Compression, Flagging Into Fire or FailureCrude Oil has been grinding higher within a clean rising wedge (bearish flag), forming within the aftermath of a strong sell-off. Price is now testing a key Intraday Fair Value Gap (1H FVG) inside a broader HTF Macro Supply Zone, while respecting a steep trend line of support.
This structure sets up a textbook decision point. Continuation toward macro liquidity or reversal and breakdown.
Bearish Setup (Primary Thesis)
Rejection off the Intraday FVG (1H) or Macro Supply Zone. Close below green trend line with momentum/volume
Bearish Entries:
Entry #1 (Aggressive): $69.90–$70.10 → wick rejection inside FVG
Entry #2 (Conservative): $68.20 → trendline break + close below
Stop Loss Options:
Tight SL: $70.80 (above intraday FVG)
Wide SL: $72.50 (above macro supply zone)
Bearish TPs:
TP1: $67.00 → channel low
TP2: $65.00 → mitigation zone
TP3: $64.00 → FVG fill + prior swing low (final target)
The Ideal setup: FVG rejection + trend line break + aggressive follow-through = hold for full breakdown.
Bullish Setup (Alternate Scenario)
Clean breakout + 1H/4H candle close above Intraday FVG. Break and retest of channel top as new support. Price holds above $70.50 with strength
Bullish Entry:
Breakout & retest at $70.10–$70.30
Stop Loss:
Below FVG/demand pocket: $68.30
Bullish TPs:
TP1: $72.50 → prior swing high
TP2: $74.00 → macro trendline test
TP3: $77.00 → macro liquidity sweep
Best setup: breakout + retest with increasing volume and no rejection at macro supply.
My Summary:
Bias. - Bearish (Primary)
Structure - Bearish flag within HTF downtrend
Price Action - Testing overhead supply + intraday FVG
Volatility - Constricted, ripe for breakout
Risk Level - Low-risk entries near supply or trend line
Model Tag - Mean Reversion Rejection / Momentum Breakdown
This is a high-probability setup with clear invalidation on both sides. Use a confirmation based approach to reduce drawdown and avoid fake outs. Plan your entries based on how price reacts at this decision zone. Be patient the cleanest trade may be on the second move, not the first. Happy Trading everyone.

CL1! Short Setup – Fading Into Volume Shelf📉 CL1! Short Setup – Fading Into Volume Shelf
🔹 Context:
Price just tapped into a heavy upper volume shelf (68.35–68.50) — the exact area where the prior breakdown started. This zone aligns with rejection highs and the upper edge of the VRVP profile.
📌 Setup Logic:
🔺 Entry: 68.36–68.50 (into supply zone)
⛔ Stop: 68.75 (above liquidity peak)
🎯 Target: 66.78 (prior demand + volume node)
📐 RRR: ~4.0:1
⚠️ Trigger: Do not enter early — wait for rollover of price which it looks like we are getting now.
📊 Why It Matters:
📈 VRVP shows clear upper and lower volume shelves
📛 Price has overextended into a prior rejection zone
🔁 Potential for a mean-reversion leg once we confirm momentum breakdown
📷 See attached chart for full zone layout
🧠 Let me know if you’re entering or watching this one 👇
#CrudeOil #CL1 #FuturesTrading #VolumeProfile #SciQua #OrderFlow

CL down sub $60 before moving up above $73Expected support or reversal zone based on last swing high for CL is at $60. This matches with 0.786 fib level of last move up, suggesting a standard SBS structure forming. Expecting a move up to at least $73 (fib 0.236), possibly also well beyond this.
Based on time fib of last swing high I expect the bottom to occur before July 20th.

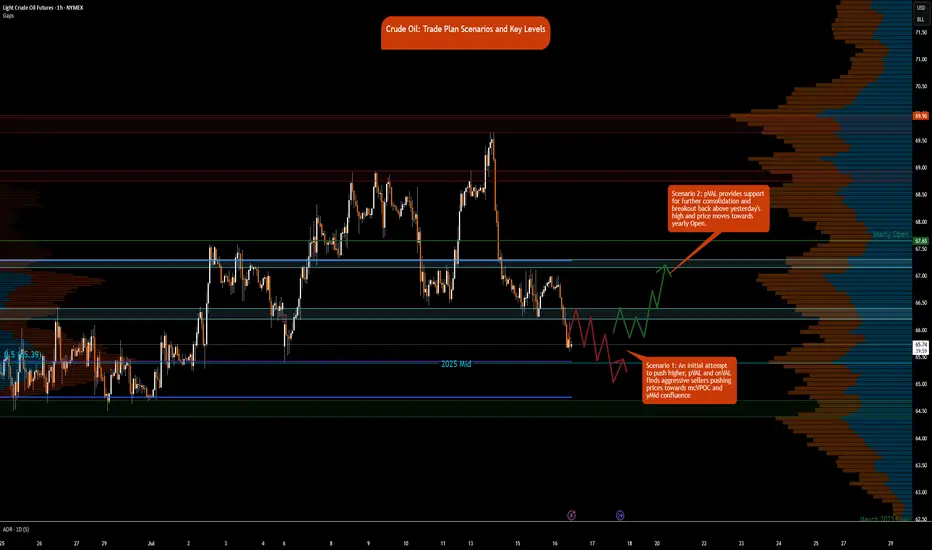
Crude Oil Trade Plan Scenarios and Key Levels
NYMEX:CL1!
It’s Wednesday today, and the DOE release is scheduled for 9:30 a.m. CT. This may provide fuel—pun intended—to push prices out of the two-day consolidation. Also, note that the August contract expires on July 22, 2025. Rollover to the September contract is expected on Thursday/Friday. You can see the pace of the roll here at CME’s pace of roll tool . The chart shows that rollover is about 70% complete, and CLU25 has higher open interest. Note, the front-month August contract is still trading at higher volume.
What has the market done?
Crude oil is in a multi-distribution profile since the peak witnessed during the Iran-Israel conflict. Crude oil formed a strong base above the 64s and traversed towards the 69s. Prices were rejected at these highs and have since reverted back towards the monthly Volume Point of Control, monthlyVPOC.
What is it trying to do?
The market is in active price discovery mode and has formed multi-distributions since June 23. The market has been consolidating after prices at highs were rejected.
How good of a job is it doing?
The market is active and is also providing setups against key levels. Patience to take trades from these higher time frame levels is what is required to trade crude oil currently. Otherwise, there is a lot of volatility and chop that can throw traders off their plan.
Key Levels:
• Yearly Open: 67.65
• Neutral zone: 67.15–67.30
• 2-Day VAL (Value Area Low): 66.40
• Neutral zone: 66.40–66.20
• 2025 Mid-Range: 65.39
• Key Support: 64.40–64.70
What is more likely to happen from here?
Scenario 1: An initial attempt to push higher, pVAL and onVAL finds aggressive sellers pushing prices towards mcVPOC and yMid confluence
Scenario 2: pVAL provides support for further consolidation and break back above yesterday's high and price moves towards yearly Open.
Glossary:
pVAL: Prior Value Area Low
onVAL: Overnight Value Area Low
yMid: 2025 Mid-Range
mcVPOC: Micro Composite Volume Point of Control
WTI(20250716)Today's AnalysisMarket news:
① The annual rate of the overall CPI in the United States in June rose to 2.7%, the highest since February, in line with market expectations, and the monthly rate was 0.3%, the highest since January, in line with market expectations; the annual rate of the core CPI rose to 2.9%, the highest since February, lower than the expected 3%, but slightly higher than 2.8% last month, and the monthly rate was 0.2%, lower than the market expectation of 0.3%.
② Interest rate futures still show that the Fed is unlikely to cut interest rates this month, but there is a high possibility of a 25 basis point cut in September.
③ Fed mouthpiece: The CPI report will not change the Fed's policy direction.
④ Trump: Consumer prices are low and the federal funds rate should be lowered immediately. The Fed should cut interest rates by 3 percentage points.
⑤ Fed Collins: The core inflation rate is expected to remain at about 3% by the end of the year, and the Fed should maintain active patience.
Technical analysis:
Today's buying and selling boundaries:
65.66
Support and resistance levels:
66.49
66.18
65.98
65.34
65.14
64.83
Trading strategy:
If the price breaks through 65.66, consider buying, the first target price is 65.98
If the price breaks through 65.34, consider selling, the first target price is 65.14
CRUDEOIL FUTURE - BULLISH VIEWCrudeoil just showed a reversal from 0.618 golden fibonnaci zone. It may go till 6000-6100 levels in coming weeks with 5700 as strong support.
please do your own research before taking any trades. This chart is only for educational purpose

Oil Futures Approaching Key Reversal Zone – Bullish HarmonicOil futures may be forming a bullish Shark harmonic pattern, with price approaching the potential reversal zone at point D. This pattern suggests a possible bounce if buyers step in around this area. If price action shows signs of support or a shift in momentum, it could offer a solid long opportunity. Look for confirmation like bullish candles or indicators turning up before entering. If the pattern plays out, it could provide a strong risk-to-reward setup.

Crude Oil: Key Breakout Levels Suggest Bullish MomentumCurrent Price: $65.81
Direction: LONG
Targets:
- T1 = $67.45
- T2 = $69.30
Stop Levels:
- S1 = $64.20
- S2 = $62.50
**Wisdom of Professional Traders:**
This analysis synthesizes insights from thousands of professional traders and market experts, leveraging collective intelligence to identify high-probability trade setups. The wisdom of crowds principle suggests that aggregated market perspectives from experienced professionals often outperform individual forecasts, reducing cognitive biases and highlighting consensus opportunities in Crude Oil.
**Key Insights:**
Crude Oil is showing signals of a potential recovery after recent bearish movements. Technical indicators such as the Relative Strength Index (RSI) and Moving Average Convergence Divergence (MACD) demonstrate bullish divergence, suggesting upward momentum could be on the horizon. Additionally, easing geopolitical tensions may stabilize global energy markets, fostering an environment for prices to rally. Supply adjustments by OPEC+ members and ongoing production data are crucial elements to monitor, given their direct impact on crude oil price action.
**Recent Performance:**
In recent sessions, crude oil has seen a rebound following a sharp sell-off. Prices have ranged within a consolidation zone near $65. Global factors, including inflation risks and geopolitical concerns, pressured prices downward before entering a stabilization phase. This recovery is supported by improved market sentiment and reduced volatility linked to energy commodities.
**Expert Analysis:**
Market watchers have noted mixed signals in Crude Oil’s technical chart patterns, where support levels around $64 have held firmly against downward pressure. Some analysts forecast a breakout above $67 in the short term, potentially targeting the $69 range if conditions remain favorable. Factors like increased demand expectations from Asia and continued OPEC+ discipline reinforce bullish sentiment. Conversely, traders should watch for unexpected supply shocks or policy changes that could challenge upward movement.
**News Impact:**
Recent geopolitical developments, particularly reduced tensions in key oil-producing regions, have positively impacted global crude prices. Additionally, expectations of further interest rate moderation by major economies may aid crude oil’s price trajectory by reducing recession risks. The U.S.'s strategic push for renewable energy has had mixed implications for hydrocarbon demand in the short term, underpinning crude oil prices in global markets.
**Trading Recommendation:**
Given current technical setups and improving fundamentals, taking a bullish position on Crude Oil offers a promising opportunity. Key support levels suggest limited downside risk, while near-term targets provide a favorable risk-reward ratio. Traders should focus on the $67.45 mark as an initial upside pivot, with extended gains anticipated at $69.30 under strengthened bullish conditions.

bearish on oilequal lows on crude oil, but with dxy looking bullish, i feel like it would be a little problamatic trying to find a smooth ride lower. The price action is thier tho, i would defietly not be trying to long when we have eqaul lows.

CRUDE OILPreferably suitable for scalping and accurate as long as you watch carefully the price action with the drawn areas.
With your likes and comments, you give me enough energy to provide the best analysis on an ongoing basis.
And if you needed any analysis that was not on the page, you can ask me with a comment or a personal message.
Enjoy Trading ;)

US OILBullish move might continue on US OIL from our zone, can look for confirmation before entry and target Buyside.

Where’s the Oil Price Heading Amid Rising Supply and Weak DemandThe eight oil-producing nations of OPEC+ agreed to raise output in August, opting for a larger-than-expected increase. OPEC+ cited a steady global economic outlook and healthy market fundamentals. The crude oil market remains under pressure from subdued prices, persistent supply growth, and uncertain demand prospects.
WTI SOARED ON CONFLICT, SANK JUST AS FAST ON CEASEFIRE
June saw heightened volatility in WTI crude prices, driven by a short-lived conflict between Israel and Iran. Prices surged from USD 68/b on 12/Jun (one day before Israel struck Iran) to a five-month high of USD 78.40/b on 23/Jun, following the U.S. strike on three Iranian nuclear facilities.
Fears of a potential closure of the Strait of Hormuz, a critical chokepoint for ~20% of global oil flows, amplified the rally.
However, prices swiftly retreated as a ceasefire was announced within 24 hours. The rapid de-escalation erased most of the geopolitical risk premium, pushing crude back toward pre-conflict levels. Implied volatility and skew also dropped.
Source: CME CVOL
While flare-ups like Iran halting cooperation with the U.N. nuclear watchdog on 02/Jul (Wed) briefly lifted WTI prices but a surprise U.S. inventory build quickly capped the gains.
Overall, June’s rally was driven by geopolitical shocks, not sustained fundamentals. Oversupply concerns remain dominant.
OPEC+ ACCELERATES OUTPUT RESTORATION EVEN AS DEMAND WORRIES LOOM
With geopolitical tensions easing, market attention has shifted back to supply-demand fundamentals. Global oil demand remains sluggish, heightening concerns of a potential oversupply, especially as OPEC+ continues to unwind its production cuts.
On 05/Jul (Sat), eight key members of the OPEC+ alliance—Saudi Arabia, Russia, the UAE, Iraq, Kuwait, Kazakhstan, Algeria, and Oman met virtually and agreed to raise oil output in August. Instead of the anticipated 411,000 bpd increase, the group opted for a steeper hike of 548,000 bpd.
OPEC+ has been curbing output since 2022 to support prices. However, the alliance began reversing course this year to regain market share, amid rising competition from non-OPEC producers and pressure from Washington to help ease fuel prices.
This group began unwinding the voluntary cut of 2.2 million bpd in April. The original plan was to gradually increase production by 137,000 bpd each month through September 2026. Yet, after only one month at that pace, the group accelerated the process, tripling the monthly hike to 411,000 bpd for May, June, and July.
As of August, OPEC+ will have restored 1.92 million bpd of the 2.2 million bpd initially cut, leaving just 280,000 bpd to be brought back.
Following years of output cuts to stabilize prices, OPEC+ is now focused on expanding its market share as global supply competition intensifies.
DEMAND SIGNALS FLASH UNSEASONAL SUMMER WEAKNESS
Recent data paints a bearish demand picture. U.S. crude inventories unexpectedly rose by 3.8 million barrels in the week ending 27/Jun, defying forecasts of a 3.5 million-barrel draw.
A build during peak summer signals weak consumption. Gasoline demand fell to 8.6 million bpd, while stockpiles surged by 4.2 million barrels exceeding expectations of a 0.7 million barrel build.
Source: EIA and Investing.com
Adding to concerns, the U.S. labour market showed signs of strain, with private payrolls unexpectedly dropping by 33,000 in June, according to the ADP report . Analysts had expected private payrolls to rise by 99,000. The soft employment data suggests broader economic weakness that could further dampen fuel use.
China offered a rare positive note, with its Caixin Manufacturing PMI returning to expansion (above 50) in June on stronger orders and output. However, the rebound is unlikely to meaningfully shift the global demand narrative.
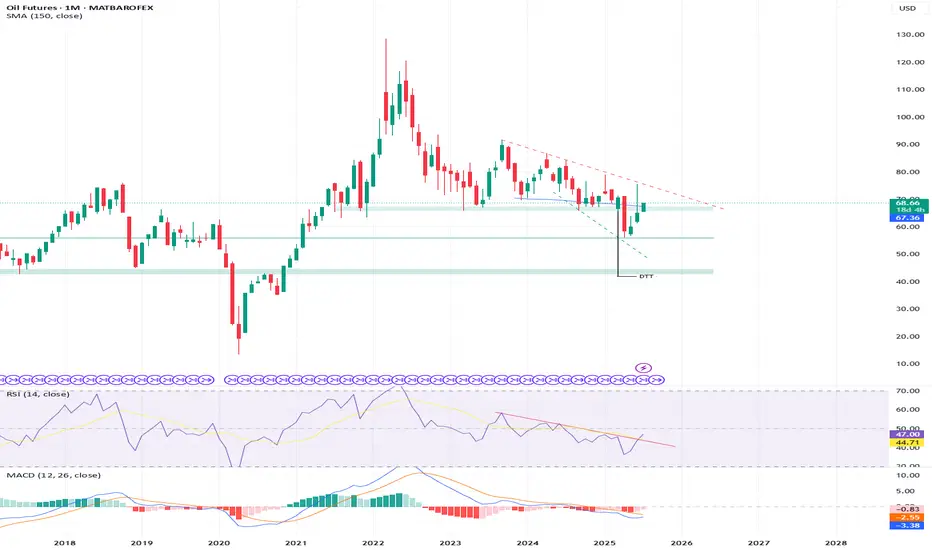
WTI TECHNICALS SIGNAL SUSTAINED BEARISH MOMENTUM
As prices retreated from five-month highs post-ceasefire, technical signals turned bearish, a death cross formed on 02/Jul as the 21-day DMA crossed the 9-day DMA, reinforcing downside momentum.
Meanwhile, uncertainty over potential U.S. tariffs after the 09/Jul (Wed) deadline continues to cloud trade and demand outlooks.
Prices slipped below the 150-day SMA on 24/Jun and have held beneath it since, reinforcing the bearish trend.
A bearish MACD and fading RSI underscore continued weakness in WTI prices.
HYPOTHETICAL TRADE SETUP
While the medium-term outlook for WTI remains bearish, the coming week could see heightened volatility driven by two key factors: OPEC+’s larger-than-expected production increase and the U.S. tariff decision due on 09/Jul (Wed).
Although the accelerated OPEC+ supply hikes are priced in, downward pressure on prices is likely to persist. Meanwhile, the U.S. tariff decision adds a layer of uncertainty; any escalation or renewal of tariffs could weigh further on oil prices, while a rollback might offer temporary support.
Aside from another geopolitical shock, upside risks remain limited. In this context, a long straddle is a prudent strategy to capture potential sharp price swings in either direction.
Source: CME QuikStrike
This paper proposes a long straddle strategy using the Monday weekly WTI crude oil options expiring on 14/Jul (ML2N5), designed to benefit from heightened volatility regardless of price direction.
The position involves purchasing a USD 66.50/b call and a USD 66.50/b put, resulting in breakeven levels at USD 63.58/b and USD 69.42/b. The total cost of the trade is a net premium of USD 2.92/b, or USD 2,920 per contract.
The strategy offers unlimited upside potential if prices move beyond the breakeven levels, while the maximum loss is limited to the premium paid.
The accompanying chart, generated via CME Group’s QuikStrike Strategy Simulator , provides a detailed visualization of the strategy’s performance under various market scenarios.
MARKET DATA
CME Real-time Market Data helps identify trading set-ups and express market views better. If you have futures in your trading portfolio, you can check out on CME Group data plans available that suit your trading needs tradingview.com/cme .
DISCLAIMER
This case study is for educational purposes only and does not constitute investment recommendations or advice. Nor are they used to promote any specific products, or services.
Trading or investment ideas cited here are for illustration only, as an integral part of a case study to demonstrate the fundamental concepts in risk management or trading under the market scenarios being discussed. Please read the FULL DISCLAIMER the link to which is provided in our profile description.

CRUDEOIL1! at Best Support Zone !!This is the Daily Chart of CRUDEOIL1!.
CRUDEOIL1! having a good law of polarity at 5500-5600 level .
CRUDEOIL1! is currently trading between its quarterly pivot 5603 level and monthly pivot 5805 levels , indicating a range-bound movement."
Once the Crudeoil1! sustains above the monthly pivot, it may trigger a potential upside rally."
If this lop is sustain , then we may see higher prices in CRUDEOIL1!
Thank You !!

Crude Oil and the BOS bearish move might steps in?Watching the volume rising is a good confirmation for the Bearish Bias.
Follow @GoldenZoneFX For more Content and valuable insights.

WTI(20250717)Today's AnalysisMarket news:
The annual rate of PPI in the United States in June was 2.3%, lower than the expected 2.5%, the lowest since September 2024, and the previous value was revised up from 2.6% to 2.7%. Federal Reserve Beige Book: The economic outlook is neutral to slightly pessimistic. Manufacturing activity declined slightly, and corporate recruitment remained cautious.
Technical analysis:
Today's buying and selling boundaries:
65.20
Support and resistance levels:
66.59
66.07
65.74
64.67
64.33
63.83
Trading strategy:
If it breaks through 65.74, consider buying in, and the first target price is 66.07
If it breaks through 65.20, consider selling in, and the first target price is 64.67
CL BULLISHHello,
I just noticed that oil has a good chance of rising, with a slight short-term uptrend, and I hope this helps you with your trading.
See you soon.

WTI(20250715)Today's AnalysisMarket news:
Sources said that after Trump's latest trade tax threat, the European Central Bank will discuss a more negative scenario next week than expected in June. The ECB is still expected to keep interest rates unchanged at its meeting on July 24. Discussions on rate cuts are still postponed to September.
Technical analysis:
Today's buying and selling boundaries:
66.63
Support and resistance levels:
69.20
68.24
67.62
65.65
65.02
64.06
Trading strategy:
If it breaks through 66.63, consider buying in, the first target price is 67.62
If it breaks through 65.65, consider selling in, the first target price is 65.02

Oil Went Back to 'Pre-conflict' Level on Israel-Iran Ceasefire The Israel-Iran ceasefire has triggered a sharp reversal in global oil markets, sending prices tumbling back to levels seen before the recent conflict. Brent crude ICEEUR:BRN1! fell below $70 per barrel and West Texas Intermediate NYMEX:CL1! dropped to around $65, erasing the risk premium that had built up during nearly two weeks of hostilities. This rapid decline—nearly 17% from the conflict’s peak—reflects investor relief that the threat of major supply disruptions, especially through the vital Strait of Hormuz, has receded for now.
However, the outlook remains uncertain. While the ceasefire has calmed immediate fears, the truce is fragile, with both sides accusing each other of violations within hours of its announcement. Shipping activity through the Strait of Hormuz is still subdued, insurance costs for tankers remain elevated, and some shipowners are steering clear of the region, indicating persistent caution in energy logistics.
If the ceasefire holds, markets may stabilize further, supporting global economic recovery and easing inflationary pressures.
But any renewed escalation or disruption in the Strait of Hormuz could quickly reverse these gains, keeping energy markets on alert for further geopolitical shocks.
The main technical graph for Dec'25 WTI Futures NYMEX:CLZ2025 indicates on 'cup and handle' technical structure with the nearest support around $62 per bll, and further 'double top' price action in upcoming development.
--
Best wishes,
@PandorraResearch Team 😎
